Operating supercomputing clusters for frontier artificial intelligence models—such as training clusters comprising 4,096 to 16,384 NVIDIA H100/H200/B200 GPUs interconnected via 3.2 Tbps InfiniBand or RoCEv2 fabrics—represents the highest operational expenditure in modern computing. At this scale, an AI cluster costs between $30,000 and $100,000 per hour in amortized capital and electrical power.
If a subtle software bug, thermal throttling event, or networking pause frame degrades cluster efficiency by just 10%, millions of dollars are lost every week. Achieving world-class performance requires deep instrumentation into:
- Mathematical Efficiency Metrics: Model FLOPs Utilization (MFU) vs. Hardware FLOPs Utilization (HFU).
- Communication Diagnostics: Profiling NVIDIA Collective Communications Library (NCCL) execution, identifying straggler ranks, and tracing network fabric congestion.
- Hardware Telemetry & Automated Self-Healing: Monitoring DCGM counters, classifying XID hardware faults, and orchestrating elastic job recovery.
1. Context & Architecture Setting
Unlike distributed web services or microservices where independent worker failures only affect isolated user requests, large-scale distributed AI workloads operate as tightly coupled parallel state machines:
- Synchronous Collective Barriers: Algorithms like Distributed Data Parallelism (DDP), ZeRO-1/2/3, Tensor Parallelism (TP), and Pipeline Parallelism (PP) require all GPU ranks to synchronize gradients and activations at every training step.
- The Weakest Link Principle: If 4,095 GPUs operate at 100% efficiency, but 1 GPU throttles its clock speed to 50% due to dust on a heat sink, all 4,096 GPUs operate at 50% efficiency.
- Silent Degradation: The cluster does not crash or emit errors; it simply runs slower. Without precise MFU observability, teams burn millions of compute hours without realizing their infrastructure is degraded.
+-------------------------------------------------------------------------------+
|                       AI CLUSTER OBSERVABILITY STACK                          |
+-------------------------------------------------------------------------------+
| Application Layer: PyTorch Profiler / Kineto (Kernel Launches, Tensor Streams)|
+-------------------------------------------------------------------------------+
| Communication Layer: NCCL Flight Recorder / Tracing (Ring/Tree AllReduce)     |
+-------------------------------------------------------------------------------+
| Fabric Layer: InfiniBand Subnet Mgr / RoCEv2 Telemetry (PFC Pauses, ECN Drops)|
+-------------------------------------------------------------------------------+
| Hardware Layer: NVIDIA DCGM / NVML (SM Clocks, Power Caps, XID Error Events)  |
+-------------------------------------------------------------------------------+
2. Architectural Mental Model: The Roofline & MFU
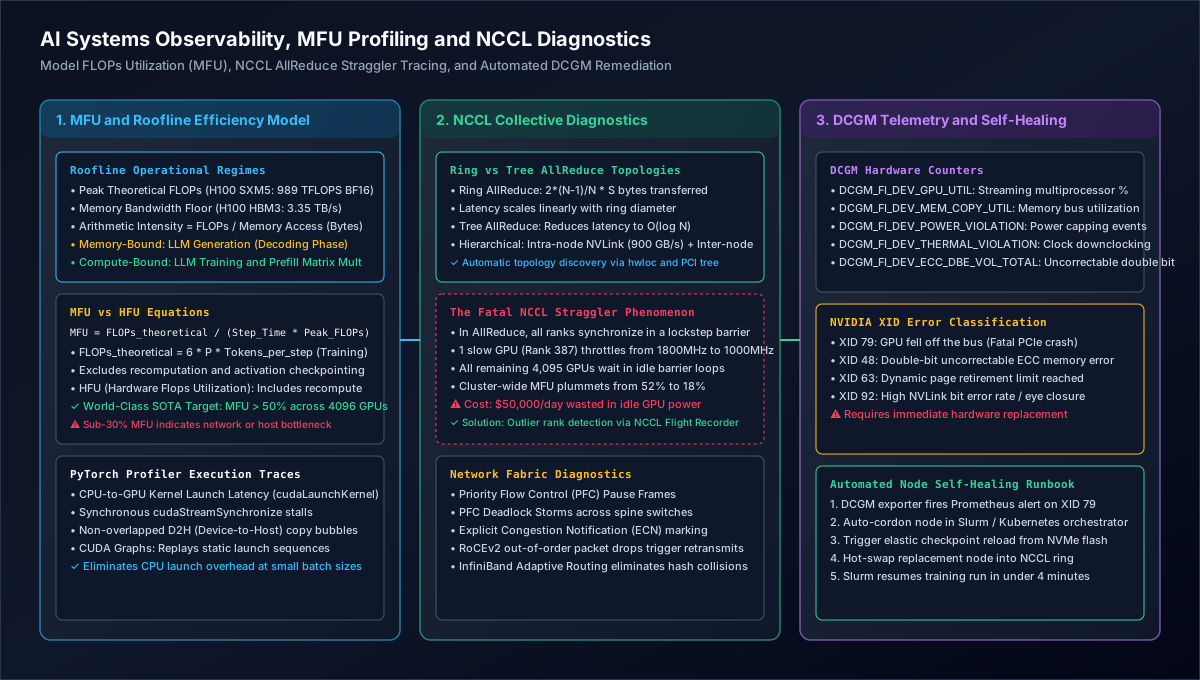
1. MFU and Roofline Efficiency Model & Roofline Operational Regimes
Establishes the ingress and structural boundary across MFU and Roofline Efficiency Model & Roofline Operational Regimes: Peak Theoretical FLOPs (H100 SXM5: 989 TFLOPS BF16); Memory Bandwidth Floor (H100 HBM3: 3.35 TB/s); Arithmetic Intensity = FLOPs / Memory Access (Bytes).
2. NCCL Collective Diagnostics & Ring vs Tree AllReduce Topologies
Coordinates core data-plane execution and state transitions through NCCL Collective Diagnostics & Ring vs Tree AllReduce Topologies: Ring AllReduce: 2*(N-1)/N * S bytes transferred; Latency scales linearly with ring diameter; Tree AllReduce: Reduces latency to O(log N).
3. DCGM Telemetry and Self-Healing & DCGM Hardware Counters
Enforces durability, state convergence, and output verification across DCGM Telemetry and Self-Healing & DCGM Hardware Counters: DCGM_FI_DEV_GPU_UTIL: Streaming multiprocessor %; DCGM_FI_DEV_MEM_COPY_UTIL: Memory bus utilization; DCGM_FI_DEV_POWER_VIOLATION: Power capping events.
The Roofline Model for GPUs
Every neural network operator falls into one of two physical regimes bounded by hardware ceilings:
- Memory Bandwidth Bound: The GPU Tensor Cores sit idle waiting for weights or KV caches to load from High Bandwidth Memory (HBM). Characterized by low Arithmetic Intensity (). Examples: LLM autoregressive token generation, batch normalization, element-wise activations.
- Compute Bound: The GPU memory bus easily feeds the cores; performance is limited by the raw mathematical throughput of the Tensor Cores. Characterized by high Arithmetic Intensity. Examples: Large matrix multiplications () in transformer self-attention projections and feed-forward networks (FFN) during training and prefill phases.
Model FLOPs Utilization (MFU) Math
Let:
- = Total number of active parameters in the model (e.g., for LLaMA-3 70B).
- = Number of tokens processed per training step ().
- = Measured step execution time in seconds.
- = Total number of GPUs in the cluster.
- = Theoretical peak floating-point throughput per GPU for the chosen precision (e.g., for NVIDIA H100 SXM5 in BF16 without sparsity).
The standard theoretical minimum FLOPs required to train a transformer is well established by Chinchilla and PaLM scaling laws: Where accounts for the forward pass, and accounts for the backward pass (computing gradients with respect to activations and weights).
The Model FLOPs Utilization (MFU) is defined as:
MFU vs. HFU Comparison
| Metric | Definition | Includes Recomputation? | Target SOTA Range |
|---|---|---|---|
| Model FLOPs Utilization (MFU) | True algorithmic work vs. hardware peak | NO (Strictly ) | |
| Hardware FLOPs Utilization (HFU) | Physical Tensor Core ops vs. hardware peak | YES (Counts activation checkpointing) |
If an engineering team observes but , they immediately know that of their cluster capacity is wasted on recomputing intermediate activations rather than advancing training!
3. NCCL Collective Diagnostics & The Straggler Problem
The NVIDIA Collective Communications Library (NCCL) coordinates data movement across GPUs. In a data-parallel or tensor-parallel step, all participating ranks execute an AllReduce to average gradients:
+-------------------------------------------------------------------------------+
|               THE FATAL NCCL ALLREDUCE STRAGGLER BOTTLENECK                   |
+-------------------------------------------------------------------------------+
| Rank 0 (Healthy 1800 MHz) : [Compute: 80ms] -> [Waiting in NCCL Barrier 70ms] |
| Rank 1 (Healthy 1800 MHz) : [Compute: 80ms] -> [Waiting in NCCL Barrier 70ms] |
| ...                                                                           |
| Rank 387 (THROTTLED 950MHz): [Compute: 150ms] -> [Completes AllReduce]        |
|                                                                               |
| Result: All 4,096 GPUs spend 70ms idling. Total step time = 150ms instead of 80ms!|
| Cluster MFU drops from 52% to 27%!                                            |
+-------------------------------------------------------------------------------+
Detecting the Straggler Rank
To identify the offending GPU out of 4,096 nodes:
- NCCL Flight Recorder: High-speed, in-memory circular ring buffer that logs collective start, execution, and wait timestamps without performance overhead.
- Outlier Kernel Duration: The straggler is not the GPU spending the most time in NCCL; it is the GPU spending the least time in NCCL, because it spent the most time computing while everyone else waited at the collective barrier!
4. Hardware Telemetry & NVIDIA DCGM
The NVIDIA Data Center GPU Manager (DCGM) provides low-level hardware monitoring through kernel-level counters:
+-------------------------------------------------------------------------------+
|                        KEY DCGM METRICS & ALERT THRESHOLDS                    |
+-------------------------------------------------------------------------------+
| Field Identifier              | Description           | Critical Alert Rule   |
+-------------------------------+-----------------------+-----------------------+
| DCGM_FI_DEV_SM_CLOCK          | Current SM Frequency  | Alert if clock < 90%  |
|                               | (MHz)                 | of rated base clock   |
+-------------------------------+-----------------------+-----------------------+
| DCGM_FI_DEV_THERMAL_VIOLATION | Milliseconds spent in | Alert if > 100ms in   |
|                               | thermal throttling    | a 1-minute window     |
+-------------------------------+-----------------------+-----------------------+
| DCGM_FI_DEV_POWER_VIOLATION   | Milliseconds spent in | Alert if persistent;  |
|                               | power-cap throttling  | check PSU/PDU voltage |
+-------------------------------+-----------------------+-----------------------+
| DCGM_FI_DEV_ECC_DBE_VOL_TOTAL | Double-bit uncorrect- | Alert IMMEDIATELY;    |
|                               | able ECC memory error | GPU memory corrupted! |
+-------------------------------+-----------------------+-----------------------+
| DCGM_FI_DEV_NVLINK_CRC_ERR    | CRC checksum errors   | Alert if rate > 10/s; |
|                               | on NVLink high-speed  | cable/connector loose |
+-------------------------------+-----------------------+-----------------------+
Critical NVIDIA XID Errors
When a fatal hardware or driver error occurs, the NVIDIA kernel driver logs an XID error to the Linux kernel ring buffer (dmesg):
- XID 79: GPU has fallen off the bus: The PCIe controller lost electrical contact with the GPU. The device cannot be recovered via software resets; the physical node must be cordoned and replaced.
- XID 48: Double-bit ECC error: Uncorrectable corruption occurred in High Bandwidth Memory (HBM). Any tensors resident in that memory are invalid.
- XID 63: Dynamic page retirement limit reached: Too many single-bit ECC errors occurred in specific memory banks. The driver retires pages, reducing total available VRAM.
5. Practical Engineering Simulation: Cluster MFU Profiler & Straggler Detector
The following self-contained TypeScript simulation calculates MFU and analyzes collective communication traces across simulated GPU ranks to automatically isolate straggler nodes and identify hardware throttling.
/**
 * Systems Notebook - AI Cluster MFU Profiler & NCCL Straggler Detector
 */

interface GPURankMetrics {
  rankId: number;
  nodeId: string;
  smClockMhz: number;
  computeTimeMs: number;
  ncclWaitTimeMs: number;
  xidErrors: number[];
}

interface ClusterTrainingStep {
  stepId: number;
  stepTimeMs: number;
  tokensProcessed: number;
  modelParameterCount: number;
  peakGpuTflopsBf16: number;
  ranks: GPURankMetrics[];
}

class AIClusterObservabilityEngine {
  /**
   * Calculate Model FLOPs Utilization (MFU)
   * Formula: MFU = (6 * P * Tokens) / (Step_Time_Sec * Num_GPUs * Peak_FLOPs)
   */
  public calculateMFU(step: ClusterTrainingStep): number {
    const numGpus = step.ranks.length;
    const stepTimeSec = step.stepTimeMs / 1000;
    const theoreticalFlops = 6 * step.modelParameterCount * step.tokensProcessed;
    const peakClusterFlops = numGpus * (step.peakGpuTflopsBf16 * 1e12);

    const achievedFlopsPerSec = theoreticalFlops / stepTimeSec;
    const mfu = achievedFlopsPerSec / peakClusterFlops;

    return mfu;
  }

  /**
   * Isolate the Straggler Rank
   * The straggler is the rank with the HIGHEST compute time and LOWEST barrier wait time!
   */
  public diagnoseStraggler(ranks: GPURankMetrics[]): {
    stragglerRank: GPURankMetrics;
    meanComputeMs: number;
    delayRatio: number;
  } {
    const totalCompute = ranks.reduce((sum, r) => sum + r.computeTimeMs, 0);
    const meanComputeMs = totalCompute / ranks.length;

    // Rank with the maximum compute duration
    const straggler = ranks.reduce((worst, curr) =>
      curr.computeTimeMs > worst.computeTimeMs ? curr : worst
    );

    const delayRatio = straggler.computeTimeMs / meanComputeMs;

    return {
      stragglerRank: straggler,
      meanComputeMs,
      delayRatio
    };
  }

  /**
   * Health Remediation Evaluation
   */
  public evaluateNodeRemediation(rank: GPURankMetrics): 'HEALTHY' | 'THROTTLED' | 'FATAL_CORDON' {
    if (rank.xidErrors.includes(79) || rank.xidErrors.includes(48)) {
      return 'FATAL_CORDON'; // GPU fell off bus or fatal double-bit ECC
    }
    if (rank.smClockMhz < 1200) {
      return 'THROTTLED'; // Thermal downclocking
    }
    return 'HEALTHY';
  }
}

// -------------------------------------------------------------
// Verification Execution
// -------------------------------------------------------------
function runDiagnosticsDemo(): void {
  const engine = new AIClusterObservabilityEngine();

  // Simulate 8 GPU ranks in a pipeline/data parallel group
  const sampleRanks: GPURankMetrics[] = [
    { rankId: 0, nodeId: 'dgx-node-01', smClockMhz: 1830, computeTimeMs: 82, ncclWaitTimeMs: 68, xidErrors: [] },
    { rankId: 1, nodeId: 'dgx-node-01', smClockMhz: 1830, computeTimeMs: 81, ncclWaitTimeMs: 69, xidErrors: [] },
    { rankId: 2, nodeId: 'dgx-node-01', smClockMhz: 1830, computeTimeMs: 83, ncclWaitTimeMs: 67, xidErrors: [] },
    { rankId: 3, nodeId: 'dgx-node-01', smClockMhz: 1830, computeTimeMs: 82, ncclWaitTimeMs: 68, xidErrors: [] },
    { rankId: 4, nodeId: 'dgx-node-02', smClockMhz: 1830, computeTimeMs: 80, ncclWaitTimeMs: 70, xidErrors: [] },
    { rankId: 5, nodeId: 'dgx-node-02', smClockMhz: 1830, computeTimeMs: 82, ncclWaitTimeMs: 68, xidErrors: [] },
    { rankId: 6, nodeId: 'dgx-node-02', smClockMhz: 1830, computeTimeMs: 81, ncclWaitTimeMs: 69, xidErrors: [] },
    // Degraded GPU on Node 02 (Thermal Throttle down to 1050 MHz)
    { rankId: 7, nodeId: 'dgx-node-02', smClockMhz: 1050, computeTimeMs: 148, ncclWaitTimeMs: 2,  xidErrors: [63] }
  ];

  const trainingStep: ClusterTrainingStep = {
    stepId: 4520,
    stepTimeMs: 150, // Stalled by Rank 7
    tokensProcessed: 32768,
    modelParameterCount: 70e9, // 70 Billion Parameter Model
    peakGpuTflopsBf16: 989,    // NVIDIA H100 SXM5 Peak
    ranks: sampleRanks
  };

  console.log('=== Step 1: MFU Evaluation ===');
  const mfu = engine.calculateMFU(trainingStep);
  console.log(`Measured MFU: ${(mfu * 100).toFixed(2)}% (Target: > 45%)`);

  console.log('\n=== Step 2: Collective Straggler Analysis ===');
  const diagnostic = engine.diagnoseStraggler(sampleRanks);
  console.log(`Identified Straggler: Rank ${diagnostic.stragglerRank.rankId} on Node ${diagnostic.stragglerRank.nodeId}`);
  console.log(`Compute Time: ${diagnostic.stragglerRank.computeTimeMs}ms vs Group Average: ${diagnostic.meanComputeMs.toFixed(1)}ms`);
  console.log(`Delay Factor: ${diagnostic.delayRatio.toFixed(2)}x slower than cluster baseline`);

  console.log('\n=== Step 3: Hardware Remediation Trigger ===');
  const action = engine.evaluateNodeRemediation(diagnostic.stragglerRank);
  console.log(`Remediation Recommendation for ${diagnostic.stragglerRank.nodeId}: [${action}]`);
}

runDiagnosticsDemo();
6. Observability & SRE Metrics
+-------------------------------------------------------------------------------+
|                       AI INFRASTRUCTURE SRE DASHBOARD                         |
+-------------------------------------------------------------------------------+
| Metric Indicator       | Prometheus / DCGM Metric | Alert Condition & Action  |
+------------------------+--------------------------+---------------------------+
| Cluster MFU            | calculated_cluster_mfu   | Alert if MFU < 40% for    |
|                        |                          | > 3 consecutive steps     |
| NCCL Barrier Wait P99  | nccl_allreduce_wait_ms   | Alert if wait time > 40%  |
|                        |                          | of total step duration    |
| RoCEv2 PFC Pause Rx    | switch_pfc_pause_rx_rate | Alert if pause rate > 100/s|
|                        |                          | network congestion storm  |
| GPU Hardware XID Fault | nvidia_xid_error_counter | Alert IMMEDIATELY if      |
|                        |                          | XID in [48, 79, 92]       |
+------------------------+------------------------+-----------------------------+
7. Comprehensive Architectural Summary
Maintaining high-efficiency AI infrastructure requires moving beyond traditional operating system CPU and memory metrics:
- Model FLOPs Utilization (MFU) provides the definitive mathematical benchmark of cluster productivity by comparing algorithmic theoretical minimums against physical peak hardware limits.
- Collective Straggler Detection identifies the single slow GPU rank that delays the entire synchronous AllReduce communication barrier.
- Automated DCGM Self-Healing classifies XID errors and thermal violations, cordoning degraded nodes and restoring jobs from checkpoint storage before cluster-wide error budgets are exhausted.
8. Failure Modes, Edge Cases, & Incident Recovery
| Hardware/Software Fault | Detection Mechanism | Immediate Impact | Automated Production Remediation |
|---|---|---|---|
| GPU Thermal Throttling | DCGM clocks_event_reasons | Clock drop from 1980 MHz to 850 MHz | Quarantine node via Kubernetes taint; migrate active rank to spare warm node |
| Silent PCIe Bus Degradation | DCGM PCIe replay / link width | Bandwidth drops from Gen5 (64 GB/s) to Gen1 (2 GB/s) | Automated pre-flight NCCL all-reduce benchmark aborts job before training |
| RoCEv2 PFC Pause Deadlock | Switch queue watermark & ECN counters | All collective traffic freezes across racks | Switch watchdog drops pause frames after 100ms; transition to DCQCN congestion notification |
| NCCL Collective Timeout | PyTorch TORCH_NCCL_ASYNC_ERROR_HANDLING=1 | Unhandled CUDA error terminates training | Head node captures flight recorder dump, triggers job restart from latest S3 checkpoint |
9. Guided Design Exercises
Exercise 1 (Foundational — MFU vs. HFU Derivation & Activation Checkpointing Cost)
A cluster of NVIDIA H100 SXM5 GPUs ( dense) pre-trains a parameter dense Transformer with global batch size sequences at sequence length tokens (). Measured step time is , and full activation checkpointing is enabled (adding forward recomputation FLOPs per step on top of ).
- Calculate the theoretical productive FLOPs per step () and the achieved Model FLOPs Utilization (MFU).
- Calculate the achieved Hardware FLOPs Utilization (HFU) () and the exact TFLOPS/GPU spent on activation recomputation.
Exercise 2 (Intermediate — NCCL Straggler Isolation & DCGM XID Triage)
During a training run, step duration suddenly jumps from to (MFU drops from to ). PyTorch Kineto and NCCL Flight Recorder traces show that ranks spend in backward GEMM kernels and inside ncclDevKernel_AllReduce, whereas Rank 319 (dgx-node-40, GPU 7) spends in GEMM compute and only in ncclDevKernel_AllReduce.
- Explain why a naive alert that flags the rank with the highest
ncclWaitTimeMsmisidentifies healthy victims, and write the mathematical rule that isolates Rank 319. - Specify the exact DCGM / Linux diagnostic commands to distinguish thermal throttling (
DCGM_FI_DEV_THERMAL_VIOLATION), PCIe lane downgrade (LnkSta), and fatal hardware errors (XID 48,XID 63,XID 79), along with the automated orchestrator action for each.
Exercise 3 (Staff-Level — RoCEv2 PFC Pause Storm & Automated Warm-Spare Recovery)
During an intensive Mixture-of-Experts (MoE) All-to-All dispatch phase across a RoCEv2 cluster, switch_pfc_pause_rx_rate surges past across 4 leaf switches, freezing collective progress until TORCH_NCCL_HEARTBEAT_TIMEOUT_SEC terminates the job. Formulate the immediate switch/NIC congestion control fix (DCQCN ECN marking + PFC watchdog) and the automated pre-flight + warm-spare recovery workflow.
View Reference Architecture & Worked Solutions (AI-C10-001)
1. Worked Solution — Exercise 1: MFU vs. HFU Derivation & Activation Checkpointing Cost
- Productive FLOPs & Model FLOPs Utilization (MFU):
- Tokens per step: .
- Theoretical productive FLOPs per step:
- Cluster peak FLOPs over :
- Achieved MFU:
- Hardware FLOPs Utilization (HFU) & Recomputation Overhead:
- With full activation checkpointing ( hardware FLOPs):
- Recomputation Cost: ( of H100 peak FLOPs) is spent re-materializing forward activations during backpropagation; switching to selective activation checkpointing (
AI-C01-001) recovers most of this gap.
2. Worked Solution — Exercise 2: Straggler Isolation Rule & DCGM/XID Triage Runbook
- Why Minimum
ncclWaitTimeMsIdentifies the Straggler:- In a synchronous collective barrier, . Healthy ranks finish compute early () and spin inside
ncclDevKernel_AllReduce() waiting for the slowest rank to arrive. - Therefore, the straggler is uniquely identified by maximizing compute duration and minimizing barrier wait time:
For Rank 319, baseline compute time while
ncclWaitTimeMsis .
- In a synchronous collective barrier, . Healthy ranks finish compute early () and spin inside
- DCGM & Hardware Triage Commands + Automated Actions:
- Thermal / Power Downclocking: Query
dcgmi dmon -e 100,155,190,191(SM_CLOCK,POWER_USAGE,THERMAL_VIOLATION,POWER_VIOLATION). IfSM_CLOCK < 1200 MHzdue to fan/coolant fault drain node after checkpoint, taintnvidia.com/gpu-throttled:NoSchedule. - PCIe Lane Degradation: Run
lspci -vvv -s <bus_id> | grep LnkSta. If downgraded fromSpeed 32GT/s, Width x16(PCIe Gen5) toGen1/Gen2 x1cordon node for hardware reseating. - Fatal XID Faults (
dmesg -T | grep NVRM):XID 79(GPU fell off the bus) orXID 48(Double-Bit ECC Error): Unrecoverable in software immediately cordon node (kubectl cordon), abort current step, swap in a warm-spare node, and resume from the latest sharded checkpoint.XID 63(Row Remapper / Page Retirement): Schedule node maintenance after current checkpoint boundary.
- Thermal / Power Downclocking: Query
3. Worked Solution — Exercise 3: RoCEv2 PFC Storm Mitigation & Elastic Recovery
- Lossless RoCEv2 Fabric Tuning (Preventing PFC Pause Storms):
- Enable DCQCN (Data Center Quantized Congestion Notification): Configure switch egress queues to set ECN (Explicit Congestion Notification) IP header bits at a low buffer watermark (e.g., ) well before the physical buffer hits the PFC XOFF threshold (), so ConnectX-7 NICs throttle injection rate smoothly before any
802.1QbbPAUSE frame is emitted. - Enable a Switch PFC Deadlock Watchdog (
pfc-wd/ SONiC watchdog at ): If a port remains paused continuously for due to a cyclic pause loop, temporarily drop/drain queued packets to break the deadlock so NCCL can recover via RDMA retransmission rather than hanging the entire fabric.
- Enable DCQCN (Data Center Quantized Congestion Notification): Configure switch egress queues to set ECN (Explicit Congestion Notification) IP header bits at a low buffer watermark (e.g., ) well before the physical buffer hits the PFC XOFF threshold (), so ConnectX-7 NICs throttle injection rate smoothly before any
- Automated Pre-Flight & Warm-Spare Elastic Recovery:
- Set
TORCH_NCCL_ASYNC_ERROR_HANDLING=1andTORCH_NCCL_DUMP_ON_TIMEOUT=1to capture the NCCL Flight Recorder JSON trace on timeout. - Maintain a pool of pre-validated warm-spare nodes; upon rank failure or timeout, the orchestrator runs a pair-wise
all_reduce_perfbisection check to isolate the faulted node, swaps in the warm spare viatorchrunelastic rendezvous, and restores the latest asynchronous checkpoint in .
- Set
10. Authoritative References & Industry Baselines
- Vijay K. Adhikari et al. (2020), “Operational Machine Learning at Scale: Hardware and Infrastructure Telemetry”, ACM SIGOPS — doi.org/10.1145/3419111
- NVIDIA Corporation (2024), “NVIDIA Data Center GPU Manager (DCGM) Architecture & API Reference” — docs.nvidia.com/datacenter/dcgm/latest/
- Meta AI Engineering (2024), “The Llama 3 Herd of Models: Infrastructure, Cluster Telemetry, and Straggler Mitigation” — arxiv.org/abs/2407.21783
- Version Context: Diagnostic standards reflect NVIDIA DCGM 3.3+, PyTorch 2.3+ Profiler, and NCCL 2.21+.