1. The problem
Suppose a product stakeholder specifies: “Our checkout platform must deliver 100% uptime, zero errors, and sub-50 ms responses worldwide.”
On a single development laptop, that sounds aspirational. In production distributed systems, 100% availability is physically unattainable: NVMe drives suffer uncorrectable bit errors, backhoe operators sever regional fiber conduits, BGP route leaks blackhole traffic, and routine deployments introduce edge-case bugs.
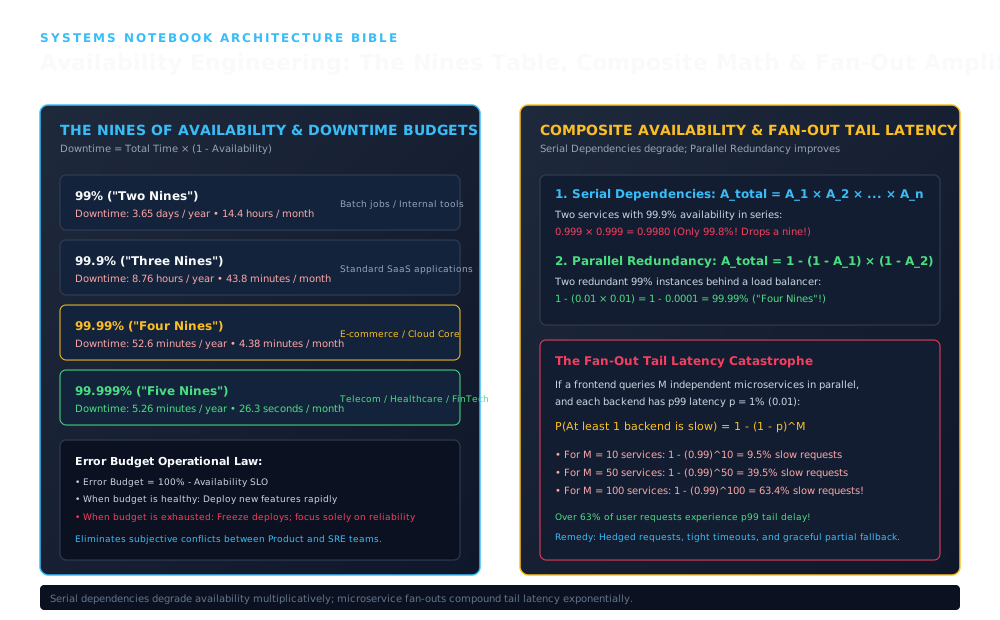
1. 99% ("Two Nines") & 9% ("Three Nines")
Establishes the ingress and structural boundary across 99% ("Two Nines") & 9% ("Three Nines"): Downtime: 3.65 days / year • 14.4 hours / month; Batch jobs / Internal tools; Downtime: 8.76 hours / year • 43.8 minutes / month.
2. 999% ("Five Nines") & Error Budget Operational Law
Coordinates core data-plane execution and state transitions through 999% ("Five Nines") & Error Budget Operational Law: Downtime: 5.26 minutes / year • 26.3 seconds / month; Telecom / Healthcare / FinTech; Error Budget = 100% - Availability SLO.
3. Serial Dependencies: A_total = A_1 × A_2 × ... × A_n & The Fan-Out Tail Latency Catastrophe
Enforces durability, state convergence, and output verification across Serial Dependencies: A_total = A_1 × A_2 × ... × A_n & The Fan-Out Tail Latency Catastrophe: Two services with 99.9% availability in series: 0.999 × 0.999 = 0.9980 (Only 99.8%! Drops a nine!); 2. Parallel Redundancy: A_total = 1 - (1 - A_1) × (1 - A_2) Two redundant 99% instances behind a load balancer: 1 - (0.01 × 0.01) = 1 - 0.0001 = 99.99% ("Four Nines"!); If a frontend queries M independent microservices in parallel, and each backend has p99 latency p = 1% (0.01): P(At least 1 backend is slow) = 1 - (1 - p)^M.
When an organization refuses to quantify acceptable failure:
- Naive callers omit fallbacks: Upstream services assume dependencies never fail, turning a transient stall in a minor loyalty-points microservice into a complete checkout outage.
- Runaway infrastructure spend: Engineers over-build multi-region active-active consensus clusters ( cost and complexity) for internal dashboards that only needed availability.
- Alert fatigue & burnout: Every 10-second network blip pages on-call engineers at 3:00 AM, even when users barely noticed.
Reliability engineering replaces vague promises with rigorous probability: defining measurable SLIs, setting economically rational SLO error budgets, and structuring serial/parallel topologies so composite math satisfies the target.
2. Mental model: The error budget
Treat an availability target not as pass/fail perfection, but as a depletable error budget over a rolling window (standard SRE practice uses a 30-day rolling window ):
- If your service commits to a availability SLO, your error budget is ().
- Across valid requests in 30 days, up to requests may fail without breaching the objective.
- In pure time-based uptime over 30 days, you have of allowed outage budget.
┌────────────────────────────────────────────────────────┐
│            100% Valid Traffic (30-Day Window)          │
├─────────────────────────────────────────────┬──────────┤
│          99.9% Must Meet SLI Criteria       │   0.1%   │
│                  (Your SLO)                 │  Budget  │
└─────────────────────────────────────────────┴──────────┘
An error budget balances innovation velocity against stability. Shipping features, upgrading Linux kernels, and running chaos tests spend small fractions of the budget. As long as remaining budget is healthy, releases proceed rapidly; if an incident exhausts the 30-day budget, non-urgent feature rollouts pause until reliability work restores headroom.
3. Core concepts: SLI vs. SLO vs. SLA
These three terms define distinct layers between raw telemetry, engineering governance, and commercial liability:
   [ SLI ]  ───► Quantitative measurement (e.g., 99.94% of requests < 200ms & non-5xx over 30d)
      │
      ▼
   [ SLO ]  ───► Internal engineering objective & alert trigger (e.g., >= 99.90% over 30d)
      │
      ▼
[ SLA ] ───► External legal contract with financial credits (e.g., < 99.50% triggers 10% refund)| Term | Full Name | Engineering Definition | Concrete Production Specification |
|---|---|---|---|
| SLI | Service Level Indicator | Exact ratio of good events to valid events measured as close to the user as possible. | |
| SLO | Service Level Objective | Numerical threshold on an SLI over a compliance window that governs alerting and release policy. | ” of valid checkout requests return non-5xx in () over a rolling 30-day window.” |
| SLA | Service Level Agreement | Commercial contract with customers defining financial service credits or termination rights upon breach. | “Monthly uptime entitles customer to a billing credit; entitles credit.” |
Defensive Buffer Rule: Always set your internal SLO at least tighter in error budget than your external SLA (e.g., SLO error budget vs. SLA error budget) so automated burn-rate alerts trigger mitigation long before contractual SLA penalties occur.
4. Internal workings: The “Nines” of availability
Time-based availability measures the fraction of operational time a system satisfies its specification, while request-based availability measures the fraction of valid requests served successfully:
where MTBF is Mean Time Between Failures and MTTR is Mean Time To Recovery (detection + diagnosis + mitigation). Notice that cutting MTTR from to via automated failover improves availability just as much as making hardware fail less often!
The Standard Availability Tiers
Using a standard Julian year (, average calendar month ):
| Availability | Tier Name | Error Budget | Downtime / Year () | Downtime / Avg Month () | Downtime / Day () | Typical Architectural Requirement |
|---|---|---|---|---|---|---|
| Two nines | () | Single-AZ service, nightly batch pipelines | ||||
| Three nines | () | (30d: ) | () | Rolling deploys, multi-AZ standby DB failover | ||
| Three-and-a-half nines | () | (30d: ) | Active-active stateless pods across AZs | |||
| Four nines | () | (30d: ) | Multi-AZ active-active, automated DB failover, bulkheads | |||
| Five nines | () | (30d: ) | Multi-region active-active, zero human-in-the-loop recovery |
(Note: In a 365-day non-leap year of , is and is ; in a 30-day rolling Prometheus SLO window of , is exactly .)
5. Mathematics: Composite system availability
Assume component failures are statistically independent (we examine correlated failure violations in Section 9).
1. Serial Dependencies (Every component on the critical path must succeed)
If a request requires Components to all succeed:
[ Client ] ──► [ API Gateway (99.9%) ] ──► [ Auth Service (99.9%) ] ──► [ Primary DB (99.9%) ]The Microservice Serial Chain Tax: Serial availability is strictly lower than its weakest link. Chaining synchronous microservices that each boast uptime degrades end-to-end availability to —increasing annual downtime from to !
2. Parallel Active-Active Redundancy (At least one replica must succeed)
If independent active-active replicas serve a tier and any single healthy replica can handle the load without saturating, the tier fails only when all replicas fail simultaneously:
For two identical () stateless application nodes behind health-checked routing:
3. Worked Example: Ideal Active-Active vs. Imperfect Primary-Standby Failover
Consider a three-tier web architecture:
- Load Balancer Tier: active-active redundant nodes ().
- Application Tier: active-active stateless worker pods across AZs ( each, over-provisioned so 1 pod can carry peak load).
- Database Tier: Primary PostgreSQL node + synchronous standby replica ( each).
Case A — Idealized Independent Parallel Bound ( instant failover):
- ()
- ()
- ()
- Composite Serial Availability:
Case B — Realistic Primary-Standby Failover ( automation success): In real databases, promoting a standby requires quorum consensus, fencing the old primary (STONITH/lease expiry), and re-routing clients. If automated failover succeeds with probability when the primary fails ():
Insight: Even a chance of failover stalls (e.g., split-brain fencing delay or DNS TTL caching) triples total system downtime—proving why failover controllers must be continuously chaos-tested!
6. Tail latency amplification in fan-out architectures
Availability SLIs include latency thresholds because a response arriving after the caller’s deadline is functionally an error.
Suppose an API aggregator fans out one user request to independent leaf services in parallel and must wait for all responses. If each leaf service has probability of experiencing a latency spike (e.g., GC pause or NVMe compaction stall):
| Parallel Fan-Out () | Operational Impact | ||
|---|---|---|---|
| service | Matches single-service | ||
| services | Single-node becomes user-facing ! | ||
| services | Nearly 2 in 5 users suffer tail stalls | ||
| services | Median () user experience is now worse than leaf ! |
Mitigation — Hedged Requests: As demonstrated by Dean & Barroso (The Tail at Scale), if the caller waits until the leaf’s latency mark before sending a secondary hedged read to a different replica (and cancels the slower duplicate), total backend load rises by only , while fan-out latency drops dramatically (for two independent replicas, tail probability drops from to roughly per leaf).
7. Implementation: Error Budget Burn & Composite Availability Simulator in TypeScript
export interface ServiceTier {
  name: string;
  availability: number;      // e.g. 0.999
  redundancyCount: number;   // 1 = single instance, >1 = parallel pool
  failoverReliability?: number; // optional: 1.0 = active-active, <1.0 = primary-standby controller success
}

export interface BurnAlertEvaluation {
  burnRate: number;
  timeToExhaustionHours: number;
  severity: 'OK' | 'TICKET' | 'PAGE_SLOW_BURN' | 'CRITICAL_FAST_BURN_PAGER';
}

export class ErrorBudgetBurnSimulator {
  private readonly targetSlo: number;
  private readonly windowDays: number;

  constructor(targetSlo = 0.999, windowDays = 30) {
    this.targetSlo = targetSlo;
    this.windowDays = windowDays;
  }

  public getAllowedDowntimeMinutes(): number {
    const totalMinutes = this.windowDays * 24 * 60;
    const allowedErrorRate = 1 - this.targetSlo;
    return Math.round(totalMinutes * allowedErrorRate * 100) / 100;
  }

  public static calculateCompositeAvailability(tiers: ServiceTier[]): number {
    let composite = 1.0;
    for (const tier of tiers) {
      if (tier.redundancyCount <= 1) {
        composite *= tier.availability;
      } else if (tier.failoverReliability !== undefined && tier.failoverReliability < 1.0) {
        // Primary + (redundancyCount - 1) standbys gated by failover controller probability
        const primaryUp = tier.availability;
        const primaryDown = 1 - primaryUp;
        const atLeastOneStandbyUp = 1 - Math.pow(1 - tier.availability, tier.redundancyCount - 1);
        const tierAvail = primaryUp + primaryDown * tier.failoverReliability * atLeastOneStandbyUp;
        composite *= tierAvail;
      } else {
        const unavail = Math.pow(1 - tier.availability, tier.redundancyCount);
        composite *= 1 - unavail;
      }
    }
    return composite;
  }

  public static calculateFanOutTailLatency(pTail: number, serviceCount: number): number {
    const pAllFast = Math.pow(1 - pTail, serviceCount);
    return Math.round((1 - pAllFast) * 10000) / 100;
  }

  public evaluateBurnRate(observedErrorFraction: number): BurnAlertEvaluation {
    const allowedErrorFraction = 1 - this.targetSlo;
    const burnRate = Math.round((observedErrorFraction / allowedErrorFraction) * 10) / 10;
    const totalWindowHours = this.windowDays * 24; // 720h for 30d
    const timeToExhaustionHours =
      burnRate > 0 ? Math.round((totalWindowHours / burnRate) * 10) / 10 : Infinity;

    // Google SRE Workbook multi-window burn-rate thresholds (14.4x = 2% budget in 1h; 6x/144x fast burn)
    let severity: BurnAlertEvaluation['severity'] = 'OK';
    if (burnRate >= 144) {
      severity = 'CRITICAL_FAST_BURN_PAGER'; // 100% budget burned in <= 5 hours
    } else if (burnRate >= 14.4) {
      severity = 'PAGE_SLOW_BURN';           // 100% budget burned in <= 50 hours (~2.1 days)
    } else if (burnRate > 1.0) {
      severity = 'TICKET';
    }

    return { burnRate, timeToExhaustionHours, severity };
  }
}

export function runDemo(): void {
  console.log('=== Availability Engineering & Error Budget Simulation ===');

  const idealActiveActive: ServiceTier[] = [
    { name: 'Active-Active Load Balancers', availability: 0.9999, redundancyCount: 2 },
    { name: 'Stateless App Pods (3 AZs)', availability: 0.99, redundancyCount: 3 },
    { name: 'Database Replicas (Ideal Parallel)', availability: 0.999, redundancyCount: 2 },
  ];

  const realisticFailover: ServiceTier[] = [
    { name: 'Active-Active Load Balancers', availability: 0.9999, redundancyCount: 2 },
    { name: 'Stateless App Pods (3 AZs)', availability: 0.99, redundancyCount: 3 },
    {
      name: 'PostgreSQL Primary + Standby (99.5% Failover)',
      availability: 0.999,
      redundancyCount: 2,
      failoverReliability: 0.995,
    },
  ];

  const idealComposite = ErrorBudgetBurnSimulator.calculateCompositeAvailability(idealActiveActive);
  const realisticComposite = ErrorBudgetBurnSimulator.calculateCompositeAvailability(realisticFailover);

  console.log(`[Architecture] Ideal Active-Active Composite: ${(idealComposite * 100).toFixed(4)}%`);
  console.log(`[Architecture] Realistic DB Failover Composite: ${(realisticComposite * 100).toFixed(4)}%`);

  const sim = new ErrorBudgetBurnSimulator(0.999, 30);
  console.log(`[Error Budget] 99.9% SLO allows ${sim.getAllowedDowntimeMinutes()} minutes downtime per 30 days`);

  const incident = sim.evaluateBurnRate(0.02); // 2.0% observed 5xx rate vs 0.1% budget
  console.log(
    `[Incident Telemetry] Observed 2% error rate -> Burn Rate: ${incident.burnRate}x | Exhaustion: ${incident.timeToExhaustionHours}h | Alert: ${incident.severity}`
  );

  console.log('[Fan-Out Tail Latency Amplification (leaf p99 = 1%)]');
  for (const count of [1, 10, 50, 100]) {
    const prob = ErrorBudgetBurnSimulator.calculateFanOutTailLatency(0.01, count);
    console.log(`  Fan-out ${count} services: ${prob}% chance user hits p99 tail latency`);
  }
}

runDemo();
Simulation Execution Output & State Transitions
=== Availability Engineering & Error Budget Simulation ===
[Architecture] Ideal Active-Active Composite: 99.9998%
[Architecture] Realistic DB Failover Composite: 99.9993%
[Error Budget] 99.9% SLO allows 43.2 minutes downtime per 30 days
[Incident Telemetry] Observed 2% error rate -> Burn Rate: 20x | Exhaustion: 36h | Alert: PAGE_SLOW_BURN
[Fan-Out Tail Latency Amplification (leaf p99 = 1%)]
  Fan-out 1 services: 1% chance user hits p99 tail latency
  Fan-out 10 services: 9.56% chance user hits p99 tail latency
  Fan-out 50 services: 39.5% chance user hits p99 tail latency
  Fan-out 100 services: 63.4% chance user hits p99 tail latency
8. Design alternatives & reliability trade-offs
Every step up the availability ladder trades financial cost, write latency, and consistency complexity against reduced MTTR:
| Reliability Pattern | Achievable SLO Ceiling | Write Latency & Consistency Cost | Infrastructure Multiplier | Best Fit / When to Use |
|---|---|---|---|---|
| Single-AZ Instance + Nightly Snapshot | Lowest local write latency; RPO up to , RTO | Dev/staging, reproducible batch analytics | ||
| Multi-AZ Active-Passive Standby (Sync WAL) | cross-AZ commit RTT; , failover RTO | Core transactional SaaS & relational OLTP (PostgreSQL RDS Multi-AZ) | ||
| Multi-AZ Active-Active + Graceful Degradation | Quorum writes ( AZs); non-critical dependencies shed via circuit breakers | Payments, authentication gateways, high-volume e-commerce | ||
| Multi-Region Active-Active Consensus / CRDTs | cross-region consensus RTT (or conflict-resolution complexity for async) | Global DNS/edge routing, mission-critical financial clearing (Google Spanner / CockroachDB) |
9. Real-world implementation
- Google SRE Error Budget Governance: Google pairs each critical service with a quarterly/30-day error budget reviewed jointly by product and SRE leadership. Exhausting the budget automatically redirects engineering sprints toward post-mortem action items—removing political friction between feature velocity and stability.
- Amazon S3 (Durability vs. Availability Orthogonal Design): Amazon S3 Standard is engineered for ( nines) annual durability via synchronous erasure coding across Availability Zones, while publishing a monthly availability SLA (credits starting below ). Durability guarantees committed bytes survive hardware destruction; availability governs whether an HTTP
GET/PUTsucceeds immediately during a transient network event. - Envoy Proxy & Prometheus Multi-Window Burn Alerts: Cloud-native stacks compute edge SLIs directly from Envoy Proxy ingress histograms (
istio_requests_total,envoy_http_downstream_rq_xx) in Prometheus, alerting on simultaneous short/long burn windows (e.g., and both exceeding burn) so alerts fire quickly on real outages and reset cleanly once mitigated.
10. Failure modes and limitations
- Correlated Failure Domains (Violating Independence): The formula assumes failures are statistically independent. If three replicas run in the same Availability Zone, share one NAT gateway, expire the same TLS certificate, or execute the same poison-pill deployment artifact simultaneously, composite availability collapses back to (or ).
- Retry Amplification & Metastable Collapse: Uncoordinated retries across 3 layers of microservices ( amplification) turn a brief network stall into a sustained overload that keeps burning error budget even after the underlying fault heals. Enforce per-hop retry budgets (e.g., max extra retry traffic) or retry only at the outermost client/edge layer.
- Server-Side-Only SLI Blindness: Measuring availability solely inside application worker logs misses packets dropped by congested load balancers, broken BGP/DNS records, or TLS handshake failures—producing a “green dashboard” during a total customer blackout. Pair edge proxy metrics with external synthetic blackbox probers.
11. Operational perspective: Multi-window burn-rate alerting
Alerting on raw instantaneous error rate (5xx > 0.1% for 1m) pages engineers on harmless 60-second blips, whereas alerting on 30-day cumulative error rate reacts far too late. Instead, alert on Error Budget Burn Rate across paired windows (Google SRE Workbook standard for a 30-day / SLO):
| Alert Tier | Burn Rate | Budget Consumed | Time to Exhaustion | Paired Evaluation Windows | Operational Action |
|---|---|---|---|---|---|
| Fast Burn (Critical Page) | in | () | long AND short | Immediate 24/7 on-call page | |
| Catastrophic Burn | in | long AND short | Major incident escalation & auto-rollback | ||
| Slow Burn (Ticket) | in | long AND short | Next-business-day Jira/issue triage |
12. Knowledge check
Complete the interactive assessment quiz at the end of this lesson to test your mastery of four-nines downtime budgets, serial vs. parallel composite availability, fan-out tail-latency compounding, and hedged requests.
13. Exercises
Exercise 1: Composite Availability with Graceful Fallback
A synchronous checkout flow traverses three components in series:
- API Gateway: availability.
- Payment Processor Service: availability.
- Fraud Scoring Service: intrinsic availability, protected by a circuit-breaker fallback that automatically approves low-risk orders under $50 ( of total order volume) whenever the Fraud Scoring Service is unreachable.
Tasks:
- Compute total checkout availability without the fallback () and convert it to annual downtime hours.
- Compute the effective availability of the Fraud step with the fallback () and the resulting end-to-end checkout availability (). How many hours of annual checkout downtime did graceful degradation save?
View Reference Architecture & Worked Solutions (CORE-M01-002)
Task 1: Composite Checkout Availability Without Fallback
- Serial Chain Product ():
- Unavailability Fraction:
- Annual Downtime Hours (): (Note: Using a 365-day year of yields . Either way, the Fraud service alone drags the entire checkout pipeline below two-and-a-half nines!)
Task 2: Effective Availability With Circuit-Breaker Fallback & Downtime Saved
- Effective Fraud Step Availability (): When the Fraud Scoring Service is healthy ( of the time), of orders succeed. During the () of time it is unreachable, the circuit breaker approves the of orders under $50:
- End-to-End Checkout Availability With Fallback ():
- New Annual Downtime & Net Hours Saved: (Architectural takeaway: A 15-line bounded-risk fallback rule eliminates nearly two-thirds of total checkout outage time without adding a single server to the Fraud cluster).
14. Summary and decision guide
| Concept | Governing Equation / Engineering Rule |
|---|---|
| Serial Critical Path | — eliminate synchronous non-critical hops or wrap them in fallbacks |
| Independent Parallel Pool | — isolate failure domains across AZs, power, and rollout waves |
| Primary-Standby Failover | — imperfect failover automation dominates high-nines risk |
| Fan-Out Tail Probability | — curb fan-out width and apply -delayed hedged reads |
| Burn-Rate Paging | Page on () and () multi-window error budget burn |
15. Authoritative References & Version Context
- Observability & Runtime Context: Multi-window burn-rate formulas align with Prometheus 2.45+ / 3.x recording rules, OpenTelemetry semantic HTTP conventions, and Envoy Proxy 1.30+ hedging/retry-budget filters.
- Chris Jones, John Wilkes, Niall Murphy, and Cody Smith, “Service Level Objectives” (Chapter 4), Site Reliability Engineering: How Google Runs Production Systems (O’Reilly) — primary reference for SLI/SLO/SLA definitions and error budget governance.
- Steven Thurgood et al., “Alerting on SLOs” (Chapter 5), The Site Reliability Workbook (Google / O’Reilly) — derives the multi-window burn-rate alerting mathematics.
- Jeffrey Dean and Luiz André Barroso, “The Tail at Scale”, Communications of the ACM 56(2), pp. 74–80, 2013 — formalizes fan-out tail latency amplification and hedged/tied request mitigation.
- Amazon Web Services, “Amazon S3 Service Level Agreement” & “AWS Well-Architected Reliability Pillar: Availability Calculations” — production SLA vs. durability distinctions and composite serial/parallel calculations.