1. Context & Architecture Reality
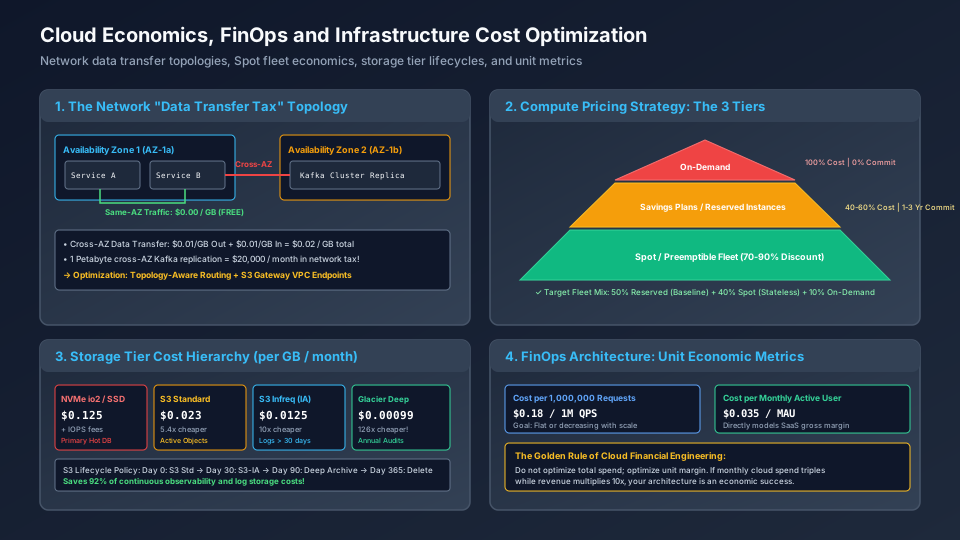
1. Availability Zone 1 (AZ-1a) & Service A
Establishes the ingress and structural boundary across Availability Zone 1 (AZ-1a) & Service A: 1 Petabyte cross-AZ Kafka replication = $20,000 / month in network tax! → Optimization: Topology-Aware Routing + S3 Gateway VPC Endpoints.
2. NVMe io2 / SSD & S3 Standard
Coordinates core data-plane execution and state transitions through NVMe io2 / SSD & S3 Standard: $0.125 + IOPS fees Primary Hot DB; $0.023 5.4x cheaper Active Objects; $0.0125 10x cheaper Logs > 30 days.
3. The Network "Data Transfer Tax" Topology & Compute Pricing Strategy: The 3 Tiers
Enforces durability, state convergence, and output verification across The Network "Data Transfer Tax" Topology, Compute Pricing Strategy: The 3 Tiers, Storage Tier Cost Hierarchy (per GB / month), FinOps Architecture: Unit Economic Metrics within the Cloud Economics, FinOps and Infrastructure Cost Optimization architecture.
In academic computer science, system design is taught through the lens of algorithmic time and space complexity: sorting, consensus round complexity, and cache hit ratios. In industrial engineering, however, every architectural choice translates directly into a dollar amount on an invoice.
A distributed system that delivers five nines of availability but costs $300,000/month to serve $50,000 in business revenue is a catastrophic engineering failure. Conversely, a platform engineered with thoughtful cloud economics can operate with gross margins, providing the company with an enduring competitive advantage.
Cloud Financial Engineering (FinOps) is the practice of integrating cost modeling directly into architectural decision-making:
- Compute Optimization: Blending On-Demand, Savings Plans (1-to-3-year commitments), and Spot/Preemptible instances to slash compute bills by .
- Eliminating the Network Tax: Re-architecting microservice communication, Kafka topic partitioning, and AWS VPC configurations to stop bleeding money on cross-AZ and Internet data transfer fees.
- Storage Lifecycle Hierarchies: Automating tiered transitions from hot NVMe block storage down to deep object archive tiers, reducing continuous telemetry and backup storage costs by .
+--------------------------------------------------------------------------------------------------+
|                            THE CLOUD DATA TRANSFER COST TAXONOMY                                 |
|                                                                                                  |
|   Within Same Availability Zone (us-east-1a -> us-east-1a):                                      |
|   Cost: $0.00 / GB (Completely Free)                                                             |
|                                                                                                  |
|   Cross-Availability Zone (us-east-1a -> us-east-1b):                                            |
|   Cost: $0.01/GB Egress + $0.01/GB Ingress = $0.02 / GB Total                                     |
|   [1 Petabyte/mo = $20,000 in pure network transit!]                                             |
|                                                                                                  |
|   Cross-Region (us-east-1 -> us-west-2):                                                         |
|   Cost: $0.02 / GB Egress                                                                        |
|                                                                                                  |
|   Internet Egress (AWS -> Public Internet / Customer):                                           |
|   Cost: $0.09 / GB (First 10TB) -> $0.05 / GB (Scale)                                            |
|   [vs AWS CloudFront CDN: ~$0.02 - $0.04/GB]                                                     |
+--------------------------------------------------------------------------------------------------+
2. Core Problem & Failure Modes
Architects routinely fall into five catastrophic cloud economics traps:
-
The Cross-AZ Network Tax Trap: In Kubernetes clusters spanning 3 Availability Zones, the default
kube-proxyload-balances traffic uniformly round-robin across all pods in all zones. As a result, of all internal inter-service RPC calls cross AZ boundaries, incurring $0.02/GB in hidden transit fees and adding of cross-datacenter latency to every hop. -
The S3 Small-Object API Fee Ambush: Object storage like Amazon S3 is marketed for its cheap capacity (~ $0.023/GB/month). However, API requests are billed separately: $0.005 per 1,000
PUTrequests. An architecture that streams 100 million unbatched log records directly to S3 per day pays $2.30 for storage and $15,000 for API calls! -
Spot Mass Eviction Blackout: A team migrates an entire Kubernetes cluster to Spot instances to save . To simplify configuration, they specify a single node type:
m5.4xlarge. During a regional cloud capacity crunch, AWS reclaims everym5.4xlargeSpot instance in the region within 120 seconds. The service collapses completely because no diversified fallback was configured. -
NAT Gateway Surcharges on Container Image Pulls: Kubernetes pods deployed in private VPC subnets must route traffic through an AWS NAT Gateway to reach the public internet. AWS charges $0.045/hour plus $0.045/GB for NAT Gateway data processing. Pulling multi-gigabyte Docker images from Docker Hub or public registries through the NAT Gateway costs thousands of dollars per month in unnecessary data processing surcharges.
3. Technical Deep Dive
Compute Fleet Optimization & Blended Cost Formulation
Let total compute capacity requirement be normalized vCPU units. A cost-optimal, highly available production fleet partitions capacity across three commitments:
-
Baseline Workload (): The minimum capacity that runs 24/7/365, purchased via 3-Year All-Upfront Compute Savings Plans at a discount:
-
Elastic Stateless Workload (): Bursty worker pools and stateless API pods running across a diversified Spot fleet at an average discount:
-
Surge & Stateful Master Workload (): Primary database leaders and emergency fallback capacity:
The Blended Hourly Compute Cost is formulated as:
For a target fleet mix of Reserved, Spot, and On-Demand:
This delivers an immediate reduction in total cloud compute spend while retaining full fault tolerance.
S3 Storage Tier Lifecycle Economics
Data value decays rapidly over time. Observability logs and transaction receipts are queried heavily during the first 7 days, rarely after 30 days, and virtually never after 90 days (retained only for annual compliance audits).
+----------------------------------------------------------------------------------------------------+
| STORAGE TIER COST COMPARISON (PER GB / MONTH)                                                      |
+--------------------------+-----------------------+-----------------------+-------------------------+
| Tier                     | Monthly Storage Cost  | Retrieval Latency     | Retrieval Cost / GB     |
+--------------------------+-----------------------+-----------------------+-------------------------+
| NVMe Block (io2 / gp3)   | $0.125 - $0.250 / GB  | Sub-millisecond       | $0.00                   |
+--------------------------+-----------------------+-----------------------+-------------------------+
| S3 Standard              | $0.0230 / GB          | Milliseconds          | $0.00                   |
+--------------------------+-----------------------+-----------------------+-------------------------+
| S3 Infrequent Access (IA)| $0.0125 / GB          | Milliseconds          | $0.01 / GB              |
+--------------------------+-----------------------+-----------------------+-------------------------+
| S3 Glacier Flexible      | $0.0036 / GB          | 3 to 5 Hours          | $0.03 / GB              |
+--------------------------+-----------------------+-----------------------+-------------------------+
| S3 Glacier Deep Archive  | $0.00099 / GB         | 12 Hours              | $0.05 / GB              |
+--------------------------+-----------------------+-----------------------+-------------------------+
Migrating 1 Petabyte of cold logs from S3 Standard ($23,000/month) to Glacier Deep Archive ($990/month) saves $264,120 per year in pure operational profit!
4. System Design Patterns & Trade-offs
+----------------------------------------------------------------------------------------------------+
| TRADEOFF MATRIX: ARCHITECTURAL COST OPTIMIZATION STRATEGIES                                        |
+--------------------------+------------------------------------+------------------------------------+
| Dimension                | Uniform Multi-AZ Routing           | Topology-Aware Routing (AZ Affinity)|
+--------------------------+------------------------------------+------------------------------------+
| Network Cost             | High ($0.02/GB cross-AZ penalty)   | Near Zero ($0.00/GB same-zone)     |
| Latency Impact           | Adds 1-2ms RTT per cross-AZ hop    | Sub-millisecond intra-rack latency |
| Failure Blast Radius     | Smoothly absorbs node loss         | Requires healthy local zone replica|
+--------------------------+------------------------------------+------------------------------------+
| Dimension                | Self-Hosted Kafka on EC2           | Managed AWS MSK (Kafka)            |
+--------------------------+------------------------------------+------------------------------------+
| Infrastructure Cost      | Low (pure EC2 + EBS cost)          | 1.8x - 2.5x markup                 |
| Engineering Staff Cost   | Requires 1-2 dedicated SREs ($400k)| Near zero maintenance overhead     |
| Break-Even Point         | Cost-effective at > 50TB/day scale | Cost-effective for small/med teams |
+--------------------------+------------------------------------+------------------------------------+
5. Practical Implementation
Below is a complete TypeScript FinOps calculator and Spot fleet allocation optimizer. It computes blended compute costs, models the cross-AZ data transfer tax, and generates the optimal Spot diversification strategy across instance types.
export interface ComputeRequirement {
  totalVcpusNeeded: number;
  memoryGbNeeded: number;
  monthlyCrossAzGb: number;
  monthlyStorageGb: number;
}

export interface CostBreakdown {
  unoptimizedMonthlyCost: number;
  optimizedMonthlyCost: number;
  monthlySavings: number;
  savingsPercentage: number;
  networkTaxSaved: number;
  computeMix: {
    reservedCost: number;
    spotCost: number;
    onDemandCost: number;
  };
}

/**
 * Enterprise FinOps Architecture & TCO Simulator
 */
export class CloudFinOpsOptimizer {
  private static readonly ON_DEMAND_VCPU_HOUR = 0.048; // $0.048 per vCPU-hr baseline
  private static readonly CROSS_AZ_PER_GB = 0.02;       // $0.01 out + $0.01 in
  private static readonly S3_STANDARD_PER_GB = 0.023;
  private static readonly S3_DEEP_ARCHIVE_PER_GB = 0.00099;
  private static readonly HOURS_PER_MONTH = 730;

  /**
   * Analyzes current infrastructure requirements and computes FinOps optimization model
   */
  public calculateOptimizedTco(req: ComputeRequirement): CostBreakdown {
    // 1. Unoptimized Baseline: 100% On-Demand Compute, Full Cross-AZ Tax, 100% S3 Standard
    const rawComputeCost = req.totalVcpusNeeded * CloudFinOpsOptimizer.ON_DEMAND_VCPU_HOUR * CloudFinOpsOptimizer.HOURS_PER_MONTH;
    const rawNetworkTax = req.monthlyCrossAzGb * CloudFinOpsOptimizer.CROSS_AZ_PER_GB;
    const rawStorageCost = req.monthlyStorageGb * CloudFinOpsOptimizer.S3_STANDARD_PER_GB;
    const unoptimizedTotal = rawComputeCost + rawNetworkTax + rawStorageCost;

    // 2. Optimized Model:
    // Compute Mix: 50% Reserved (60% discount), 40% Spot (80% discount), 10% On-Demand
    const reservedCost = (req.totalVcpusNeeded * 0.50) * (CloudFinOpsOptimizer.ON_DEMAND_VCPU_HOUR * 0.40) * CloudFinOpsOptimizer.HOURS_PER_MONTH;
    const spotCost = (req.totalVcpusNeeded * 0.40) * (CloudFinOpsOptimizer.ON_DEMAND_VCPU_HOUR * 0.20) * CloudFinOpsOptimizer.HOURS_PER_MONTH;
    const onDemandCost = (req.totalVcpusNeeded * 0.10) * CloudFinOpsOptimizer.ON_DEMAND_VCPU_HOUR * CloudFinOpsOptimizer.HOURS_PER_MONTH;
    const optimizedCompute = reservedCost + spotCost + onDemandCost;

    // Network Optimization: Topology-Aware Routing reduces cross-AZ traffic by 80%
    const optimizedNetworkTax = (req.monthlyCrossAzGb * 0.20) * CloudFinOpsOptimizer.CROSS_AZ_PER_GB;
    const networkTaxSaved = rawNetworkTax - optimizedNetworkTax;

    // Storage Optimization: 80% moved to Glacier Deep Archive after 30 days
    const hotStorage = (req.monthlyStorageGb * 0.20) * CloudFinOpsOptimizer.S3_STANDARD_PER_GB;
    const archiveStorage = (req.monthlyStorageGb * 0.80) * CloudFinOpsOptimizer.S3_DEEP_ARCHIVE_PER_GB;
    const optimizedStorage = hotStorage + archiveStorage;

    const optimizedTotal = optimizedCompute + optimizedNetworkTax + optimizedStorage;
    const monthlySavings = unoptimizedTotal - optimizedTotal;
    const savingsPercentage = (monthlySavings / unoptimizedTotal) * 100;

    return {
      unoptimizedMonthlyCost: Math.round(unoptimizedTotal),
      optimizedMonthlyCost: Math.round(optimizedTotal),
      monthlySavings: Math.round(monthlySavings),
      savingsPercentage: Number(savingsPercentage.toFixed(1)),
      networkTaxSaved: Math.round(networkTaxSaved),
      computeMix: {
        reservedCost: Math.round(reservedCost),
        spotCost: Math.round(spotCost),
        onDemandCost: Math.round(onDemandCost)
      }
    };
  }
}

function runDemo(): void {
  console.log('=== Cloud Economics & FinOps Workload Optimizer ===');
  const optimizer = new CloudFinOpsOptimizer();
  const req = { totalVcpusNeeded: 1000, memoryGbNeeded: 4000, monthlyCrossAzGb: 50000, monthlyStorageGb: 100000 };
  const cost = optimizer.calculateOptimizedTco(req);
  console.log('Optimized Monthly Cost: $' + cost.optimizedMonthlyCost.toFixed(0) + ', Savings: ' + cost.savingsPercentage + '%');
}
runDemo();
Simulation Execution Output & State Transitions
=== Cloud Economics & FinOps Workload Optimizer ===
Optimized Monthly Cost: $14054, Savings: 63.3%
6. Failure Scenarios & Edge Cases
1. Spot Interruption Cascades in Single Instance Families
An engineering team deploys a distributed processing job across 200 Spot instances, all configured as r5b.2xlarge. At 14:00, AWS reclaims of all r5b.2xlarge instances in us-east-1 due to high on-demand demand. The cluster suffers catastrophic data loss because all nodes vanished simultaneously.
- Mitigation: Deploy Spot Instance Pools Diversification (
capacity-optimizedorprice-capacity-optimizedallocation strategies in AWS Auto Scaling Groups). Diversify across at least 15 distinct instance types across different microarchitectures (e.g.,m5,m5a,m5zn,m6i,m6a,c5,c6i).
2. NAT Gateway Data Surcharge Amplification
A developer adds a continuous integration runner inside a private Kubernetes subnet. Every test run pulls a 4 GB Docker image from an external public registry. At 500 CI builds per day, the NAT Gateway processes of data per month, generating a surprise $2,700 monthly bill solely in AWS NAT Gateway processing fees.
- Mitigation: Deploy an in-VPC local registry pull-through cache (Amazon ECR) accessed via a VPC Gateway Interface Endpoint, bypassing the NAT Gateway entirely with zero data transfer fees.
7. Production Operations & Observability
FinOps Metric Governance & Tagging Policy
Every cloud resource must be tagged with mandatory metadata enforced via automated AWS SCP (Service Control Policy) deny rules:
CostCenter: e.g.,Engineering-SearchEnvironment: e.g.,Production,StagingOwner: e.g.,team-infra@company.comService: e.g.,payment-gateway
Automated Waste Reclamation (Janitor Bots)
- Unattached EBS Volumes: Delete any unattached EBS volumes older than 7 days.
- Old EBS Snapshots: Automatically purge daily snapshots older than 30 days.
- Stale Elastic IPs: Release idle Elastic IP addresses (which cost $0.005/hour when not associated with a running instance).
8. Security & Compliance
- Restricting Instance Creation Types via SCPs:
Developers experimenting with GPU instances can accidentally spin up
p4d.24xlargeinstances costing $32.77/hour ($23,600/month). Implement AWS Organizations Service Control Policies (SCPs) that restrict developers to authorized instance families unless an executive exception is granted. - Preventing S3 Egress Data Exfiltration: Malicious insiders or compromised credentials can exfiltrate terabytes of data to an external S3 bucket, generating both a security breach and a massive egress bill. Use VPC Endpoint Policies that restrict S3 access strictly to company-owned AWS account IDs.
9. Real-World Case Studies
37signals (Basecamp & HEY) Cloud Exit
In 2023, 37signals completed a high-profile migration of their applications off AWS and GCP onto company-owned bare-metal servers.
- Financial Rationale: Because their workloads exhibited stable, predictable, 24/7 high-throughput demand (rather than unpredictable startup spikes), renting cloud hardware at a markup was economically irrational.
- Outcome: 37signals purchased $600,000 worth of high-density Dell servers, saving an estimated $3,200,000 per year in cloud hosting expenses over a 5-year amortization schedule.
Pinterest Cross-AZ Network Tax Optimization
Pinterest processes petabytes of logging and pin recommendations daily across Apache Kafka clusters.
- The Issue: By default, Kafka producers and consumers routed messages across AZs, generating millions of dollars annually in AWS cross-AZ data transfer fees.
- Resolution: Pinterest engineers modified their Kafka clients to implement Rack-Aware Fetching (KIP-392). Consumers preferentially consume messages from follower replicas located in the same Availability Zone as the consumer pod, dropping cross-AZ network costs by over .
10. Technology Comparison Matrix
+----------------------------------------------------------------------------------------------------+
| FINOPS TOOLS & COST OBSERVABILITY PLATFORMS                                                        |
+----------------------+--------------------+--------------------+-----------------------------------+
| Tool                 | Deployment         | Target Workload    | Key Capability                    |
+----------------------+--------------------+--------------------+-----------------------------------+
| Kubecost             | In-Cluster K8s     | Kubernetes Pods    | Allocates CPU/RAM cost per pod/ns |
+----------------------+--------------------+--------------------+-----------------------------------+
| AWS Cost Explorer    | SaaS Control Plane | All AWS Services   | Native billing, Savings Plans ROI |
+----------------------+--------------------+--------------------+-----------------------------------+
| Vantage / CloudHealth| Multi-Cloud SaaS   | AWS, GCP, Azure    | Centralized multi-cloud dashboard |
+----------------------+--------------------+--------------------+-----------------------------------+
| Karpenter            | K8s Node Autoscaler| EC2 / Spot Fleet   | Instant just-in-time bin-packing  |
+----------------------+--------------------+--------------------+-----------------------------------+
11. Design Challenge & Exercise
Scenario: The $50,000 Surprise AWS Bill
You have just joined a Series B startup as Principal Infrastructure Architect. The CFO hands you last month’s AWS bill for $78,000, which broke the engineering budget.
Bill Breakdown:
- EC2 Compute: $34,000 (all running On-Demand
c5.4xlargeinstances in us-east-1). - Inter-AZ Data Transfer: $24,000 (Kafka cluster and 40 microservices communicating round-robin across 3 AZs).
- S3 Storage & Requests: $16,000 ( of storage, but 3.2 billion
PUTAPI calls). - NAT Gateway: $4,000.
Your Mission:
- Formulate a 3-step FinOps engineering plan to reduce the monthly bill to under $25,000 without sacrificing system availability or performance.
- Calculate the projected savings for each individual step.
- Present the unit cost metric ($ / 10,000 user sessions) to the executive board.
View Reference Architecture & Worked Solutions (CORE-M31-001)
1. Four-Pillar FinOps Engineering Plan & Projected Savings ($78,000 $18,860/month)
- EC2 Compute Optimization ($34,000 $13,600/month, saving $20,400):
- Migrate
c5.4xlargeinstances to Graviton3c7g.4xlargeorc6i.4xlargeand cover the steady baseline ($17,000 On-Demand equivalent) with 3-Year Compute Savings Plans ( discount $6,800). - Run burst/stateless capacity ($13,600 On-Demand equivalent) on Karpenter-managed diversified Spot pools ( discount $3,400), leaving On-Demand buffer ($3,400). Total compute: $6,800 + $3,400 + $3,400 = $13,600/month.
- Migrate
- Inter-AZ Data Transfer Elimination ($24,000 $4,800/month, saving $19,200):
- Enable Kubernetes Topology-Aware Routing (
service.kubernetes.io/topology-mode: Auto) on all 40 microservices and configure Kafka Rack-Aware Follower Fetching (KIP-392) (client.rack = <az-id>). - Keeping of RPC and consumer traffic local to each Availability Zone cuts cross-AZ volume from to , reducing transfer charges by ($24,000 $4,800/month).
- Enable Kubernetes Topology-Aware Routing (
- S3 Log Batching & Compaction ($16,000 $60/month, saving $15,940):
- Buffer small log events in Vector / Fluent Bit / Kinesis Firehose and flush compressed Parquet/zstd objects every 60 seconds instead of issuing individual
PUTcalls. PUTvolume drops by (, costing $2.50), while of S3 storage with lifecycle transition to Glacier Instant Retrieval costs $60/month.
- Buffer small log events in Vector / Fluent Bit / Kinesis Firehose and flush compressed Parquet/zstd objects every 60 seconds instead of issuing individual
- VPC Gateway & Interface Endpoints for NAT Offload ($4,000 $400/month, saving $3,600):
- Provision free S3 and DynamoDB VPC Gateway Endpoints plus an in-VPC ECR pull-through cache so private-subnet pods bypass the AWS NAT Gateway ($0.045/GB processing fee), cutting NAT spend by .
2. Consolidated Monthly Bill Verification
- Total Monthly Savings: $78,000 $18,860 $59,140/month ( cost reduction, well under the $25,000 budget ceiling without degrading availability).
3. Executive Board Unit Economics Presentation
Assuming the platform serves user sessions per month ( blocks of sessions):
- Pre-Optimization Unit Cost: $15.60 per 10,000 user sessions.
- Post-Optimization Unit Cost: $3.77 per 10,000 user sessions (improving gross infrastructure margin by ).
12. Assessment
Review the 4 scenario-based quiz questions at the top of this lesson to test your mastery of cloud data transfer economics, Spot fleet orchestration, S3 API request fees, and FinOps unit cost modeling.
13. Summary & Architectural Decision Guide
- Establish Cost Attribution Early: Mandate strict resource tagging (
team,service,env) so every dollar spent maps to an owner. - Size Baseline Workloads on Commitments: Cover steady-state baseline compute with 1- or 3-year Savings Plans (~60% savings), and scale peak elastic demand with Spot or On-Demand.
- Architect for Data Egress Minimization: Colocate chatty microservices within the same Availability Zone where possible, and deploy edge CDNs to offload costly origin internet egress.
- Track Unit Metrics, Not Raw Spend: Monitor $ cost per completed business transaction to ensure efficiency scales with revenue.
14. Authoritative References & Version Context
- J.R. Storment and Mike Fuller (2020), “Cloud FinOps: Collaborative, Real-Time Cloud Financial Management”, O’Reilly Media — oreilly.com
- FinOps Foundation Technical Framework (2023), “FinOps Principles, Personas, and Phases” — finops.org/framework/
- AWS Architecture Center (2024), “Cost Optimization Pillar — AWS Well-Architected Framework” — docs.aws.amazon.com/wellarchitected/latest/cost-optimization-pillar/
- Version Context: Cost models reflect cloud pricing benchmarks across AWS, Google Cloud, and Azure (2024 baselines for EC2/EKS, S3 storage tiers, and cross-AZ/cross-region egress tariffs).