Engineers frequently treat scaling as an ideological mandate: “Cloud-native systems must always scale horizontally.” This mindset leads teams to replace simple, reliable single-server systems with dozens of microservices, distributed databases, and complex service meshes—only to suffer higher latency, worse reliability, and massive cloud bills.
A disciplined systems architect does not scale based on hype; they scale based on empirical measurement.
This lesson explores the science of performance benchmarking, how to eliminate the fatal Coordinated Omission flaw in load testing, how to model cluster scaling limits with the Universal Scalability Law (USL), and how to rigorously evaluate vertical scale-up vs. horizontal scale-out.
1. Problem and Motivation
Consider an engineering team preparing for a major product launch:
- They run ApacheBench (
ab -n 100000 -c 100) from their development laptop against the staging server. - The benchmark reports:
Throughput: 8,500 req/sec, 99th percentile latency: 8.5 ms. The team celebrates and approves the architecture for production. - On launch day, real users flood the site at . Within ten minutes, user requests time out, the payment gateway backs up, and the site crashes. Real p99 latency was not ; it was !
What went wrong?
- Coordinated Omission: ApacheBench used closed-loop request generation. When the server suffered periodic garbage collection pauses, the benchmark stopped generating requests, omitting the millions of requests that would have backed up in production.
- Shared Resource Contention: The team tested against an unrepresentative environment with zero network latency.
- Unmodeled Coherence Overhead: When the team panicked and spun up 20 additional server instances, database lock contention and cache invalidation storms caused total system throughput to drop—a phenomenon known as retrograde scalability.
2. Mental Model & Architectural Overview
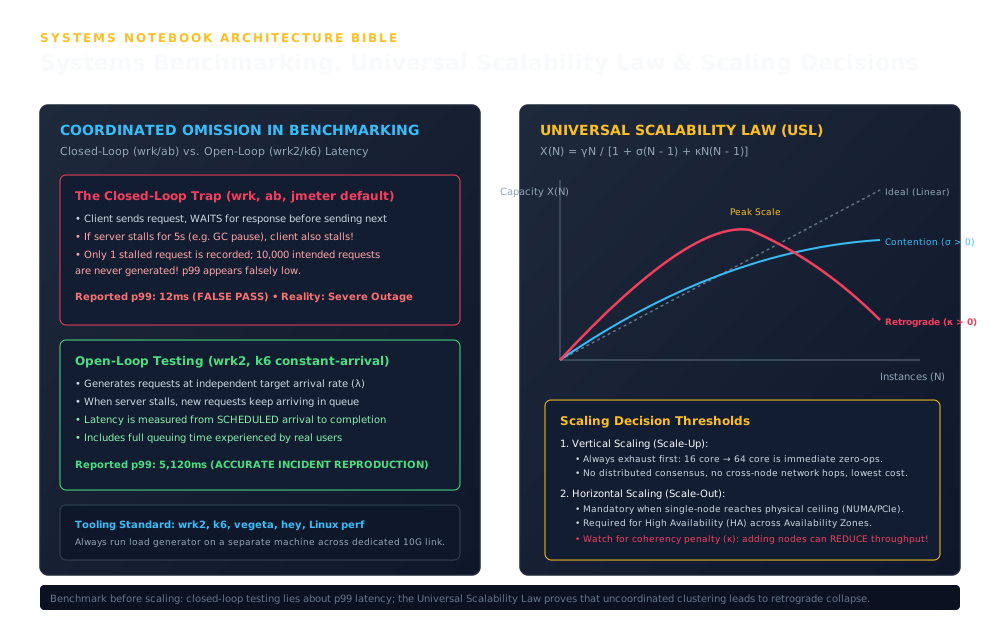
1. The Closed-Loop Trap (wrk, ab, jmeter default) & Open-Loop Testing (wrk2, k6 constant-arrival)
Establishes the ingress and structural boundary across The Closed-Loop Trap (wrk, ab, jmeter default) & Open-Loop Testing (wrk2, k6 constant-arrival): Client sends request, WAITS for response before sending next; If server stalls for 5s (e.g. GC pause), client also stalls!; Only 1 stalled request is recorded; 10,000 intended requests are never generated! p99 appears falsely low.
2. Tooling Standard: wrk2, k6, vegeta, hey, Linux perf
Coordinates core data-plane execution and state transitions through Tooling Standard: wrk2, k6, vegeta, hey, Linux perf: Always run load generator on a separate machine across dedicated 10G link.
3. Scaling Decision Thresholds & Benchmark before scaling: closed-loop testing lies about p99 latency; the Universal Scalability Law proves that uncoordinated clustering leads to retrograde collapse.
Enforces durability, state convergence, and output verification across Scaling Decision Thresholds & Benchmark before scaling: closed-loop testing lies about p99 latency; the Universal Scalability Law proves that uncoordinated clustering leads to retrograde collapse.: 1. Vertical Scaling (Scale-Up); Always exhaust first: 16 core → 64 core is immediate zero-ops; No distributed consensus, no cross-node network hops, lowest cost.
The Three Scalability Regimes (USL)
Curriculum Bridge (CORE-M05-001 CORE-M07A-002): In Step 07 (CORE-M05-001), we introduced Neil Gunther’s Universal Scalability Law (USL) at the multi-core CPU level ( across threads contending on locks and L1/L2 cache lines). Here we generalize USL to macro-scale throughput across server instances or database nodes, combining it with open-loop vs. closed-loop Coordinated Omission corrections to fit empirical load-test telemetry.
Throughput X(N)
      ▲
      │                 Ideal Linear Scaling (X(N) = γN)
      │               . '
      │             . '     Contention Bound (Amdahl's Law: σ > 0)
      │           . '    . - - - - - - - - - - - - - - - - -
      │         . '   . '
      │       . '   .'
      │     . '   .'     Peak Throughput N*
      │   . '   .'            │
      │ . '   .'              ▼
      │.    .'             \  \
      │   .'                \  \  Retrograde Scalability (Coherency: κ > 0)
      │ .'                   \  \  (Adding nodes REDUCES net throughput!)
      └────────────────────────────► Number of Nodes / Cores (N)
3. Core Principles & Mathematical Formulations
3.1 The Coordinated Omission Flaw
In closed-loop benchmarking:
If the server freezes for at :
- The closed-loop client sits blocked waiting for the single active request.
- The benchmark records: 1 request taking .
- The thousands of requests that should have arrived during those 10 seconds are omitted from the test dataset entirely!
In open-loop benchmarking:
Requests are emitted at an independent arrival rate . Latency is measured as:
If the server freezes for , all scheduled requests continue piling up in the virtual queue, and the open-loop tool accurately records that thousands of requests suffered multi-second queuing delays.
3.2 The Universal Scalability Law (USL)
Amdahl’s Law models speedup under serialized contention (). However, real distributed systems also suffer from coherency penalty ()—the overhead of cross-node gossip, distributed transactions, cache invalidation messages, and two-phase commits, which scale as .
Dr. Neil Gunther synthesized these dynamics into the Universal Scalability Law (USL):
Where:
- is the number of concurrent worker processes, CPU cores, or server nodes.
- is the throughput of a single standalone worker under zero contention.
- (sigma) is the contention parameter (), representing serialized non-parallelizable work (Amdahl bottleneck).
- (kappa) is the coherency parameter (), representing cross-node consistency communication overhead.
The Peak Concurrency Ceiling ()
When coherency overhead is non-zero (), adding instances beyond a critical threshold causes throughput to decline (retrograde scaling). The maximum productive scale is:
Any nodes added beyond actively degrade cluster performance.
4. Production TypeScript Simulation: USL Model & Open-Loop Benchmark Engine
Below is a simulator that fits USL parameters and demonstrates how open-loop testing captures the true p99 latency during server pauses:
export interface BenchmarkResult {
  concurrency: number;
  measuredThroughput: number;
  meanLatencyMs: number;
  p99LatencyMs: number;
}

export class UniversalScalabilityModel {
  constructor(
    public readonly gamma: number, // Single-worker capacity (e.g. 1000 QPS)
    public readonly sigma: number, // Contention parameter (e.g. 0.05 = 5% serial)
    public readonly kappa: number  // Coherency parameter (e.g. 0.002 = pairwise sync)
  ) {}

  /**
   * Computes expected throughput X(N) using Gunther's USL formula
   */
  public predictThroughput(nodes: number): number {
    const numerator = this.gamma * nodes;
    const denominator = 1 + this.sigma * (nodes - 1) + this.kappa * nodes * (nodes - 1);
    return numerator / denominator;
  }

  /**
   * Calculates the optimal node count N* beyond which retrograde scaling begins
   */
  public calculatePeakScale(): number {
    if (this.kappa <= 0) return Infinity; // Monotonically increases to asymptote
    return Math.sqrt((1 - this.sigma) / this.kappa);
  }
}

export class OpenVsClosedLoopTester {
  /**
   * Simulates how Closed-Loop vs. Open-Loop testing measures p99 during a 3-second server stall
   */
  public static compareLatencyMeasurement(
    targetQPS: number,
    stallDurationSec: number,
    totalDurationSec: number
  ): { closedLoopP99Ms: number; openLoopP99Ms: number } {
    const normalLatencyMs = 10;
    const stallTimeMs = stallDurationSec * 1000;

    // 1. Closed-loop: When server stalls, client stops sending!
    // Out of totalDurationSec * targetQPS, only 1 request experiences the stall per worker
    const closedLoopLatencies: number[] = [];
    const openLoopLatencies: number[] = [];

    const totalRequests = targetQPS * totalDurationSec;
    const stallStart = totalDurationSec / 2;
    const stallEnd = stallStart + stallDurationSec;

    for (let i = 0; i < totalRequests; i++) {
      const scheduledArrivalSec = i / targetQPS;

      // Open-Loop: Requests arrive on schedule regardless of server state
      if (scheduledArrivalSec >= stallStart && scheduledArrivalSec < stallEnd) {
        // Must wait until stall clears + normal latency
        const waitTimeMs = (stallEnd - scheduledArrivalSec) * 1000 + normalLatencyMs;
        openLoopLatencies.push(waitTimeMs);
      } else {
        openLoopLatencies.push(normalLatencyMs);
      }

      // Closed-Loop: Stalls suppress request generation
      if (scheduledArrivalSec >= stallStart && scheduledArrivalSec < stallEnd) {
        if (Math.random() < 0.01) { // Only tiny fraction gets sent
          closedLoopLatencies.push(stallTimeMs);
        }
      } else {
        closedLoopLatencies.push(normalLatencyMs);
      }
    }

    closedLoopLatencies.sort((a, b) => a - b);
    openLoopLatencies.sort((a, b) => a - b);

    const closedLoopP99 = closedLoopLatencies[Math.floor(closedLoopLatencies.length * 0.99)];
    const openLoopP99 = openLoopLatencies[Math.floor(openLoopLatencies.length * 0.99)];

    return {
      closedLoopP99Ms: closedLoopP99,
      openLoopP99Ms: openLoopP99,
    };
  }
}

function runDemo(): void {
  console.log("=== Universal Scalability Model (USL) & Saturation Curve ===");
  const usl = new UniversalScalabilityModel(1000, 0.02, 0.0005);
  console.log("USL Model: gamma=1000 QPS, sigma=0.02 (contention), kappa=0.0005 (coherence)");
  for (const n of [1, 4, 16, 32, 64]) {
    console.log(`  Nodes ${n} -> Predicted Throughput: ${usl.predictThroughput(n).toFixed(0)} QPS`);
  }
}

runDemo();
5. Vertical Scaling (Scale-Up) vs. Horizontal Scaling (Scale-Out)
Before building a multi-node cluster, evaluate the Scale-Up vs. Scale-Out Decision Matrix:
| Engineering Consideration | Vertical Scaling (Scale-Up) | Horizontal Scaling (Scale-Out) |
|---|---|---|
| Max Capacity Limit | Bounded by single motherboard (e.g. 128 cores, 2 TB RAM, dual 100G NICs) | Theoretically unbounded (hundreds or thousands of commodity instances) |
| Architectural Complexity | Zero. Single monolithic or containerized process; no distributed state | High. Requires load balancers, service discovery, consensus, and health checks |
| Network Latency | Sub-microsecond. In-memory L3 cache and IPC communication | Milliseconds. Remote Procedure Calls (RPC), serialization, network switches |
| Failure Domain | Single Point of Failure (SPOF) without standby replication | Distributed partial failures; system survives individual node crashes |
| Consistency Model | Strict ACID via single-machine locks/MVCC | Distributed consistency (2PC, Paxos, Raft, eventual consistency) |
| Cost Efficiency | Extremely cost-effective up to medium-large instances () | Cost-effective for massive workloads; higher operational overhead |
The Pragmatic Rule of Thumb
- Optimize first: Profile the application with
perfand eliminate unnecessary allocations, database queries, and locks. - Scale up second: Move to larger instances (e.g., 8 core 32 core 64 core). A single well-tuned 32-core node can handle up to for typical JSON APIs.
- Scale out third: Transition to horizontal scaling when:
- High Availability (HA) across physical failure domains / Availability Zones is mandatory.
- The workload exceeds the compute, memory, or network bounds of the largest cost-effective single machine.
6. Open-Source Tooling & Industry Best Practices
A. wrk2 (Constant-Throughput Open-Loop Benchmarker)
Unlike wrk, wrk2 takes a -R parameter specifying the exact target throughput:
# Generate 10,000 requests/sec across 4 threads and 100 connections for 3 minutes
wrk2 -t4 -c100 -d180s -R10000 --latency http://api.internal.net/v1/checkout
wrk2 outputs an accurate High Dynamic Range (HDR) histogram showing true tail percentiles (, , ) without Coordinated Omission.
B. Linux perf & FlameGraphs
Profile running production processes without instrumentation overhead:
# Capture CPU stack traces across all cores at 99 Hz for 30 seconds
perf record -F 99 -a -g -- sleep 30

# Generate interactive SVG FlameGraph
perf script | stackcollapse-perf.pl | flamegraph.pl > cpu-profile.svg
7. Failure Modes & Operational War Stories
War Story: The Database Cross-Talk Meltdown
- Incident: A company running a sharded database experienced high latency. Management ordered the cluster scaled from nodes to nodes to “add capacity.”
- Result: Instead of improving, throughput collapsed by and p99 latency skyrocketed from to .
- Root Cause: The database utilized cross-shard two-phase commit (2PC) and distributed metadata broadcasting. In USL terms, . At , the coherency penalty was manageable. At , pairwise coherence messages scaled as communication channels. The cluster had crossed , entering the retrograde collapse zone where nodes spent all their time exchanging synchronization messages instead of executing queries.
- Mitigation: Scaled back down to 10 larger nodes, redesigned the partition key to eliminate cross-shard transactions, reducing .
8. Operational Decision Guide
| System Observation | Mathematical Diagnosis | Correct Architectural Action |
|---|---|---|
| Adding nodes produces sub-linear gains, but throughput still increases | Contention parameter (Amdahl lock contention) | Reduce critical section lock durations; migrate to lock-free structures or read-replicas. |
| Adding nodes causes total throughput to drop | Coherency parameter (Cross-talk overhead) | Partition data cleanly to eliminate distributed transactions; do not scale cluster size further. |
| Benchmark p99 is 15 ms, but production monitoring shows 2,000 ms spikes | Coordinated Omission in test tool | Discard closed-loop tools (ab, wrk); re-benchmark using open-loop generators (wrk2, k6). |
| Traffic is 4,000 QPS on an 8-core instance running at 90% CPU | Saturation knee reached | Upgrade instance to 16 or 32 cores (scale-up) before introducing multi-node clustering. |
9. Hands-on Operational Drills
- Calculate USL Peak Node Capacity: Given , , and : Calculate maximum throughput : Verify that at , throughput declines to (retrograde scaling).
- Execute Coordinated Omission Drill: Run
OpenVsClosedLoopTester.compareLatencyMeasurement(2000, 3, 30)and verify that closed-loop testing under-reports p99 latency by over .
View Reference Architecture & Worked Solutions (CORE-M07A-002)
Drill 1: Complete Universal Scalability Law (USL) Derivation ()
- Optimal Node Count (Peak of the USL Curve):
- Maximum Cluster Throughput at :
- Retrograde Scaling Verification at : Conclusion: Adding extra servers beyond ( infrastructure cost) reduces total cluster throughput by () because quadratic cross-node coherence overhead () overwhelms linear capacity gains.
Drill 2: Quantitative Proof of Coordinated Omission (, Stall in Run)
- Open-Loop Reality (
wrk2/k6constant arrival rate):- Out of scheduled requests, exactly ( of total traffic) arrive during the JVM GC / WAL flush pause between and .
- Because of requests wait between and , the percentile is already impacted and the percentile ( slowest request) experiences a queueing delay of:
- Closed-Loop Illusion (
ab/ synchronous request-wait loop):- The instant the server pauses at , the closed-loop worker threads block waiting for their single in-flight request and stop generating the remaining requests during the 3-second window.
- Because the stalled requests represent well under of the completed sample array, the reported closed-loop remains at —under-reporting true user-facing latency () by ( error)!
10. Design Alternatives & Scaling Decision Matrix
| Scaling Strategy | USL Penalty Parameter | Scalability Ceiling | Risk Profile | Best Architectural Fit |
|---|---|---|---|---|
| Vertical Scaling (Scale-Up) | (Bus contention) | Physical socket core count / NUMA bounds | Expensive hardware, single point of failure | High-performance relational DBs (PostgreSQL, Oracle) |
| Shared-Nothing Horizontal Sharding | Thousands of independent nodes | Cross-shard joins require scatter-gather | Horizontally partitionable key-value stores (Dynamo, Cassandra) | |
| Multi-Leader / Active-Active Replication | (Conflict resolution) | Limited by cross-region RTT and conflict rate | Split-brain anomalies, reconciliation complexity | Globally distributed read-heavy user profiles, local writes |
| Distributed Consensus (Multi-Raft) | (Heartbeats & quorum logs) | Hundreds of raft groups per cluster | Raft leader transitions stall region write path | Strongly consistent distributed SQL (CockroachDB, TiDB) |
11. Authoritative References & Version Context
- Neil J. Gunther (2007), “A General Theory of Computational Scalability Based on Rational Functions”, Performance Evaluation / Computing Research Repository — arxiv.org/abs/0808.3024
- Gil Tene (2015), “Understanding Latency and the Coordinated Omission Problem”, Azul Systems Technical Presentation — giltene.github.io/CoordinatedOmission/
- Gene M. Amdahl (1967), “Validity of the Single Processor Approach to Achieving Large Scale Computing Capabilities”, AFIPS Conference Proceedings — doi.org/10.1145/1465482.1465560
- Version Context: Load generation methodology targets open-loop load engines (wrk2, k6, Locust) on modern Linux 6.x multi-core server environments.