1. The Core Engineering Challenge: The Memory Wall
Imagine profiling a high-frequency market-data router or an in-memory database shard that hits 100% CPU in htop at a disappointing . An engineer adds faster arithmetic instructions, yet throughput barely moves. Running perf stat finally reveals the culprit: Instructions Per Cycle () is . Out of every four clock cycles, the CPU core spends nearly three and a half cycles completely frozen—waiting on main memory!
A widespread architectural misconception is treating RAM as uniform and instantaneous (“we cached it in RAM, so latency is zero”). To a modern superscalar processor, uncached DRAM is a massive bottleneck.
The Divergence of CPU Compute and DRAM Latency
For decades, processor clock frequencies, core counts, and SIMD/superscalar width compounded at roughly , whereas raw DRAM row-activation latency (tRCD + tCAS) improved by only . Computer architects Wulf and McKee termed this divergence The Memory Wall:
Relative Speedup (Log Scale)
  10,000 |                                            CPU Throughput (~50%+/yr)
         |                                           /
   1,000 |                                         /
         |                                       /
     100 |                                     /
         |                       +------------+
      10 |                     /   The Memory Wall Gap
         |       +------------+
       1 |-------+---------------------------------- Raw DRAM Latency (~7%/yr)
         +------------------------------------------------------------> Year
         1980           1990           2000           2010           2026
At , one clock cycle lasts , and a modern out-of-order core (e.g., Intel Golden/Redwood Cove, AMD Zen 4/5) can issue and retire to instructions per cycle. An uncached local DDR5 DRAM read costs ( clock cycles). During a single DRAM cache miss, the core forfeits instruction-execution opportunities sitting stalled on memory capacitance.
2. Mental Model & Anatomy: The Latency Pyramid
To shield execution pipelines from DRAM latency, processors layer progressively larger SRAM caches between registers and main memory:
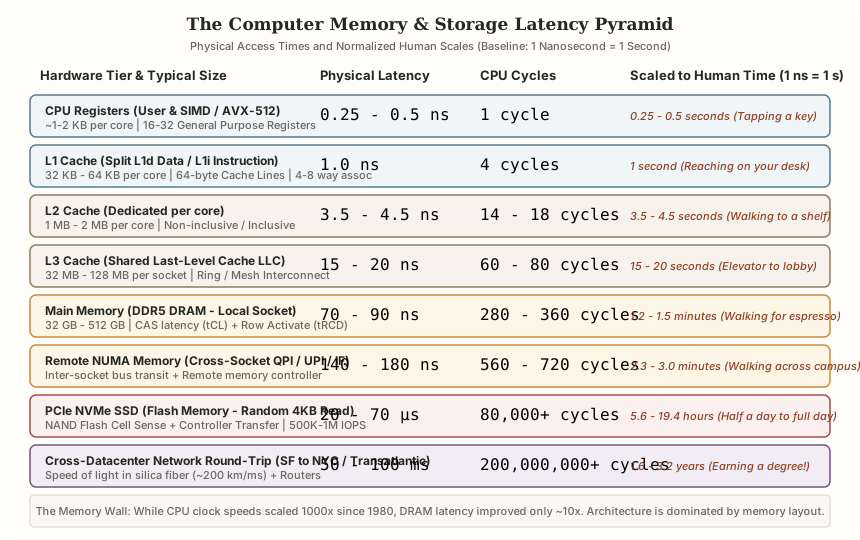
1. CPU Registers (User & SIMD / AVX-512) & L1 Cache (Split L1d Data / L1i Instruction)
Establishes the ingress and structural boundary across CPU Registers (User & SIMD / AVX-512) & L1 Cache (Split L1d Data / L1i Instruction): ~1-2 KB per core | 16-32 General Purpose Registers 0.5 - 1.0 ns 1 cycle 1 second (Single heartbeat); 32 KB - 64 KB per core | 64-byte Cache Lines | 4-8 way assoc 1.0 - 1.5 ns 4 - 5 cycles 5 seconds (Quick breath); 512 KB - 1 MB per core | Non-inclusive / Inclusive 3.5 - 4.5 ns 12 - 14 cycles 15 seconds (Writing a sentence).
2. L3 Cache (Shared Last-Level Cache LLC) & Main Memory (DDR5 DRAM - Local Socket)
Coordinates core data-plane execution and state transitions through L3 Cache (Shared Last-Level Cache LLC) & Main Memory (DDR5 DRAM - Local Socket): 16 MB - 64 MB per socket | Ring / Mesh Interconnect 15 - 20 ns 40 - 60 cycles 1 minute (Standing in an elevator); 32 GB - 512 GB | CAS latency (tCL) + Row Activate (tRCD) 60 - 80 ns 200 cycles 3.5 minutes (Boiling water / coffee); Inter-socket bus transit + Remote memory controller 140 - 180 ns 450 cycles 8 minutes (Walking around the block).
3. PCIe NVMe SSD (Flash Memory - Random 4KB Read) & Cross-Datacenter Network Round-Trip (SF to NYC / Transatlantic)
Enforces durability, state convergence, and output verification across PCIe NVMe SSD (Flash Memory - Random 4KB Read) & Cross-Datacenter Network Round-Trip (SF to NYC / Transatlantic): NAND Flash Cell Sense + Controller Transfer | 500K-1M IOPS 10 - 25 µs 30,000 cycles 8 hours (A full workday); Speed of light in silica fiber (~200 km/ms) + Routers 50 - 100 ms 200,000,000 cycles 6.5 years (An entire career span!).
Humanizing the Nanosecond
Because human intuition struggles across nine orders of magnitude ( to ), we standardize on the CORE-M01-001 baseline where (note: some microarchitectural texts alternatively normalize , which doubles every humanized duration):
| Hardware Tier | Typical Physical Latency | Humanized Scale () | Physical Intuition |
|---|---|---|---|
| CPU Register | Tapping a key under your finger | ||
| L1 Data Cache (/core) | ( cycles) | Reaching for a notebook on your desk | |
| L2 Cache (/core) | ( cycles) | Walking across the room to a bookshelf | |
| L3 Cache / LLC ( shared) | Taking the elevator to the lobby | ||
| Local Socket DDR5 DRAM | Walking down the block for espresso | ||
| Remote NUMA Socket DRAM | Walking to the far end of campus | ||
| NVMe SSD Random Read (, TLC) | Waiting half a day to a full day | ||
| Rotational HDD Mechanical Seek | Waiting a full quarter | ||
| Cross-Continent WAN RTT | Earning a master’s degree |
3. Cache Mechanics: 64-Byte Cache Lines and Data Layout
Memory controllers never transfer isolated bytes across the DDR bus. All transfers between DRAM and L1/L2/L3 caches occur in aligned fixed-width blocks called Cache Lines— on x86-64 and mainstream server ARM64 (Apple M-series uses ).
Main Memory (DRAM, 64-byte aligned blocks):
[ Byte 0 ... Byte 63 ] [ Byte 64 ... Byte 127 ] [ Byte 128 ... Byte 191 ]
          │
          ▼  (Single burst transfer populates full 64B slot)
  L1/L2/L3 Cache Line (64 Bytes = sixteen 32-bit ints or eight 64-bit doubles)
High-throughput systems exploit two forms of locality:
- Temporal Locality: Reusing hot state (loop accumulators, root B-tree pages) while lines remain resident in L1/L2.
- Spatial Locality & Hardware Prefetching: Accessing contiguous addresses (
addr,addr + 64,addr + 128). Silicon L1/L2 stream prefetchers detect constant-stride patterns and fetch upcoming cache lines from DRAM before the loop reaches them, hiding the DRAM latency almost completely.
Array-of-Structures (AoS) vs. Structure-of-Arrays (SoA)
Consider computing the volume-weighted average price across orders where each Order record totals (orderId, userId, ts, symbol, price, qty, status, flags — eight 8-byte fields):
- Array-of-Structures (AoS — Row-Oriented):
[Order_0 (64B)][Order_1 (64B)]...Readingprice() pulls all across the memory bus. Useful cache-line utilization ( of scarce memory bandwidth transports unused columns!). - Structure-of-Arrays (SoA — Columnar):
prices: [p_0, p_1, ..., p_7]Every fetch delivers eight prices ready for single-cycle AVX-512 SIMD vector addition. Cache-line utilization .
This memory-bandwidth amplification—combined with SIMD vectorization—is why columnar OLAP engines (ClickHouse, DuckDB, Apache Arrow) scan billions of rows per second where row-oriented heaps stall.
4. The Multicore Concurrency Trap: False Sharing
Each CPU core owns private L1d and L2 caches while sharing L3. Hardware Cache Coherency Protocols (MESI / MOESI: Modified, Owned, Exclusive, Shared, Invalid) keep caches consistent at 64-byte cache-line granularity:
Core 0 (Writer Thread A)                      Core 1 (Writer Thread B)
   Private L1d Cache                             Private L1d Cache
          │                                             │
          └──────────► [ Shared 64-Byte Line ] ◄────────┘
                       │ counterA │ counterB │
│ (Bytes 0-7) (Bytes 8-15)- Core 0 increments
counterA(LOCK XADDor store), transitioning the 64-byte line to Modified (M) and broadcasting an Invalidate (RFO — Read For Ownership) probe that marks Core 1’s copy Invalid (I). - Nanoseconds later, Core 1 increments
counterB(a logically unrelated field at offset+8!). Because its line is Invalid, Core 1 stalls, pulls the dirty 64-byte line from Core 0 across the interconnect, and invalidates Core 0.
Even without a single mutex lock, two cores updating adjacent counters run slower than one core due to MESI invalidation ping-pong. Remedy: align and pad independently mutated hot variables to 64-byte boundaries (alignas(64) in C++, #[repr(align(64))] in Rust, @Contended in JVM, or 16-slot Int32Array strides in JS/TS).
5. Non-Uniform Memory Access (NUMA) & TLB Page Walks
5.1 Multi-Socket ccNUMA Penalties
Dual-socket servers divide CPU cores and DDR5 channels into distinct NUMA Nodes linked by high-speed coherent fabrics (Intel UPI or AMD Infinity Fabric):
- Local NUMA Node DRAM: .
- Remote Socket DRAM: ( latency plus cross-socket link contention).
Production engines like ScyllaDB, DPDK, and Envoy Proxy bind worker threads and memory allocations strictly to local NUMA sockets:
# Pin ScyllaDB strictly to CPU cores and local DRAM on NUMA node 0
numactl --cpunodebind=0 --membind=0 /usr/bin/scylla
5.2 Virtual Memory, TLB Thrashing & HugePages
Translating a 48-bit virtual address on x86-64 (4-level paging: PML4 -> PDPT -> PD -> PT; or 5-level LA57 for 57-bit spaces) requires 4 (or 5) sequential memory lookups unless cached in the CPU’s Translation Lookaside Buffer (dTLB):
- With default pages, a 64-entry L1 dTLB spans only (and a 1,536-entry L2 STLB spans only ). Random index lookups across a PostgreSQL buffer pool constantly miss the TLB, paying up to in page-table walks before fetching the data line!
- With explicit HugePages (
vm.nr_hugepages), a 1,536-entry STLB spans ( wider reach) and eliminates the bottomPTwalk level entirely.
6. Mathematical Formulations: Average Memory Access Time (AMAT)
Let be L1 hit latency, be the incremental lookup latencies incurred upon missing the preceding level, and be the local miss rates at each cache tier:
Worked Scenario: How an L3 Miss Spike Degrades Throughput
Using , , , , with and :
- Contiguous Layout ( local miss to DRAM):
- Pointer-Chasing Heap Layout ( local miss to DRAM):
Increasing from to inflates effective load latency by ( per memory reference), cutting memory-bound query throughput by —and if pointer chasing also increases to and to , balloons to (a collapse)!
7. Design Alternatives & Memory Layout Trade-offs
| Architectural Choice | Option A | Option B | Core Trade-off & Production Guidance |
|---|---|---|---|
| Record Memory Layout | Array-of-Structures (AoS) (Row-oriented tuples) | Structure-of-Arrays (SoA) (Columnar vectors) | AoS wins for single-entity point GET/UPDATEs touching all fields of 1 row (OLTP); SoA wins by for scans/aggregations over 1–3 columns via cache-line utilization & SIMD (ClickHouse). |
| Multicore State Sharing | Shared Heap + Mutexes / Atomics | Thread-Per-Core Shared-Nothing (Seastar / ScyllaDB) | Shared heaps simplify dynamic work-stealing on uneven tasks; shared-nothing eliminates MESI lock/cache-line bouncing for ultra-low I/O engines, at the cost of explicit message passing on skew. |
| Large-Buffer Paging | Transparent HugePages (THP=always) | Explicit Static HugePages (hugetlbfs 2 MiB) | THP requires zero app config, but background/sync khugepaged compaction stalls cause latency spikes in Redis/MongoDB; static hugetlbfs (huge_pages = on in PostgreSQL) delivers deterministic TLB gains with zero defrag stalls. |
| Concurrent Telemetry Counters | Single Shared Atomic Counter | 64-Byte Padded Per-Core Stripes (LongAdder) | Single atomic is exact in RAM; padded stripes use RAM to eliminate false sharing under write contention, summing stripes lazily on read. |
8. Operational Failure Modes & Hardware Profiling
A core pinned at 99% usr in top may be retiring almost zero useful work due to memory/TLB stalls. Diagnose hardware bottlenecks directly with Linux perf and numastat:
1. Measuring Instructions Per Cycle (IPC) & Cache/TLB Misses (perf stat)
# Sample hardware PMU counters for target process PID 12345 over 10 seconds
perf stat -e cycles,instructions,cache-references,cache-misses,dTLB-load-misses -p 12345 -- sleep 10- : Healthy compute/SIMD pipeline utilization.
- with high
cache-missesordTLB-load-misses: Memory-wall or TLB-walk stall—inspect pointer chasing, AoS bloat, or missinghugetlbfs.
2. Pinpointing False Sharing Hotspots (perf c2c)
# Record hardware cache-to-cache (HITM: Hit In Modified line) coherency transfers
perf c2c record -F 60000 -- ./matching-engine
perf c2c report --stdio
High rmt_hitm / lcl_hitm counts identify the exact struct offset suffering 64-byte MESI ping-pong.
3. Auditing Cross-Socket NUMA Imbalance (numastat)
# Inspect per-NUMA-node memory residency for 'postgres' (replace with target binary name)
numastat -c postgres
Heavy memory residency on Node 0 paired with threads scheduled on Node 1 (numa_foreign / numa_miss climbing in /proc/vmstat) indicates cross-socket UPI/Infinity Fabric throttling.
9. Concrete Portable Benchmark: Spatial Locality & 64-Byte Stride Layout
This browser- and runtime-portable TypeScript benchmark compares sequential contiguous array streaming against data-dependent pointer-chasing (nextIdx = perm[idx], preventing out-of-order speculative overlap) and compares AoS vs. SoA column scans over ArrayBuffer-backed typed arrays:
/**
 * Portable Hardware-Locality Simulation:
 * 1) Sequential Stride-1 Stream vs. Data-Dependent Pointer Chasing (Cyclic Permutation)
 * 2) Array-of-Structures (64-byte stride) vs. Structure-of-Arrays (8-byte contiguous)
 */

function buildSingleCyclePermutation(length: number): Int32Array {
  // Sattolo's algorithm produces a single cyclic pointer chain of length N (zero short loops)
  const nextPtr = new Int32Array(length);
  for (let i = 0; i < length; i++) nextPtr[i] = i;

  let seed = 0x9e3779b9;
  const nextRand = (): number => {
    seed ^= seed << 13;
    seed ^= seed >>> 17;
    seed ^= seed << 5;
    return (seed >>> 0) / 4294967296;
  };

  for (let i = length - 1; i > 0; i--) {
    const j = Math.floor(nextRand() * i); // strictly j < i for single cycle
    const tmp = nextPtr[i];
    nextPtr[i] = nextPtr[j];
    nextPtr[j] = tmp;
  }
  return nextPtr;
}

export function benchmarkLocalityAndLayout(elementCount = 262_144): void {
  const values = new Int32Array(elementCount);
  for (let i = 0; i < elementCount; i++) values[i] = (i & 0xff) + 1;
  const pointerChain = buildSingleCyclePermutation(elementCount);

  // 1A. Sequential Contiguous Scan (16 Int32s per 64-byte cache line + hardware prefetcher)
  const tSeq0 = performance.now();
  let accSeq = 0;
  for (let pass = 0; pass < 8; pass++) {
    for (let i = 0; i < elementCount; i++) {
      accSeq = (accSeq + values[i]) | 0;
    }
  }
  const sequentialMs = performance.now() - tSeq0;

  // 1B. Data-Dependent Pointer Chasing (Address k+1 depends on load k -> serializes cache misses)
  const tPtr0 = performance.now();
  let accPtr = 0;
  let cursor = 0;
  for (let pass = 0; pass < 8; pass++) {
    for (let i = 0; i < elementCount; i++) {
      cursor = pointerChain[cursor];
      accPtr = (accPtr + values[cursor]) | 0;
    }
  }
  const pointerChaseMs = performance.now() - tPtr0;

  // 2. AoS (8 float64 fields = 64B per order, reading 1 field = 12.5% cache-line efficiency)
  // vs. SoA (contiguous float64 column = 100% cache-line efficiency)
  const orderCount = 65_536;
  const aosBuffer = new Float64Array(orderCount * 8);
  const soaPrices = new Float64Array(orderCount);
  for (let i = 0; i < orderCount; i++) {
    aosBuffer[i * 8 + 4] = i * 0.25;
    soaPrices[i] = i * 0.25;
  }

  const tAos0 = performance.now();
  let sumAos = 0;
  for (let pass = 0; pass < 16; pass++) {
    for (let i = 0; i < orderCount; i++) sumAos += aosBuffer[i * 8 + 4];
  }
  const aosMs = performance.now() - tAos0;

  const tSoa0 = performance.now();
  let sumSoa = 0;
  for (let pass = 0; pass < 16; pass++) {
    for (let i = 0; i < orderCount; i++) sumSoa += soaPrices[i];
  }
  const soaMs = performance.now() - tSoa0;

  console.log('=== Hardware Reality: Cache-Line Locality & Layout Benchmark ===');
  console.log(
    `[Traversal] Contiguous Array: ${sequentialMs.toFixed(2)} ms | Dependent Pointer Chase: ${pointerChaseMs.toFixed(2)} ms (Checksums: ${accSeq === accPtr ? 'MATCH' : 'DIFF'})`
  );
  console.log(
    `[Layout] AoS 64B-Stride Scan (12.5% line util): ${aosMs.toFixed(2)} ms | SoA Contiguous Column (100% line util): ${soaMs.toFixed(2)} ms (Sum match: ${sumAos === sumSoa})`
  );
}

benchmarkLocalityAndLayout();
10. Summary & Architectural Decision Guide
| Hardware Bottleneck | Symptom in Telemetry | Architectural & Systems Remedy |
|---|---|---|
| The Memory Wall (Pointer Chasing) | High CPU %usr, low , high LLC-load-misses | Flatten linked nodes into contiguous arenas, B+ trees, or columnar SoA vectors |
| MESI False Sharing | Throughput drops as thread count rises; high perf c2c HITM | Pad hot per-thread counters/ring-buffer cursors to boundaries |
| ccNUMA Cross-Socket Traffic | Elevated numa_foreign / numa_miss, memory latency | Partition workers per socket with numactl --cpunodebind --membind |
| dTLB Page-Walk Thrashing | High dTLB-load-misses on heaps/buffer pools | Provision explicit 2 MiB / 1 GiB hugetlbfs pages; disable dynamic THP defrag on latency-critical stores |
11. Guided Design Exercises
Exercise 1: Quantitative AMAT, Pointer-Chasing & HugePages TLB Math
An in-memory risk engine traverses portfolio positions across a heap on a dual-socket server (, , , local , remote NUMA ).
- Pointer-Chasing vs. Contiguous SoA AMAT: In the legacy
std::list/ pointer-linked heap layout, of DRAM accesses cross the NUMA interconnect to Socket 1, and local miss rates are , , . After refactoring to a NUMA-pinned (numactl --cpunodebind=0 --membind=0) Structure-of-Arrays (SoA) vector, miss rates drop to , , with local DRAM. Compute vs. and the resulting speedup factor. - dTLB Reach & Page-Walk Overhead: Calculate how many page-table entries are required to map the buffer pool using standard pages vs. explicit HugePages (
hugetlbfs), and compute the fraction of the working set covered by a L2 STLB in each case.
Exercise 2: Diagnosing & Eliminating MESI False Sharing in a 16-Core Telemetry Ring
A 16-core packet processor maintains per-worker telemetry in a contiguous typed array const counters = new BigInt64Array(16) shared via SharedArrayBuffer, where worker executes Atomics.add(counters, i, 1n) on every packet.
- Calculate how many worker counters share each hardware cache line and trace the MESI
M -> Iinvalidation storm across cores. - Refactor the
SharedArrayBufferlayout and indexing stride in TypeScript so each worker’s counter is isolated on its own dedicated cache line, and state the exactperf c2chardware counters that verify the fix.
View Reference Architecture & Worked Solutions (CORE-M04-001)
Exercise 1: Quantitative AMAT, Pointer-Chasing & HugePages TLB Math
- AMAT Derivation (Legacy Pointer-Chasing vs. NUMA-Pinned SoA):
- Effective DRAM Latency in Legacy Unpinned Mode ( Local / Remote NUMA):
- Legacy Pointer-Chasing ():
- NUMA-Pinned SoA ():
- Speedup Factor: ( reduced to across positions).
- dTLB Reach & Page-Table Entry Math ():
- Standard () Pages:
- Total page-table entries: ( entries of PTEs).
- STLB reach: , covering only of the working set!
- Explicit () HugePages (
hugetlbfs):- Total page-directory entries: ( fewer entries).
- STLB reach: , covering of the entire heap (sufficient to hold the entire hot Zipfian index working set in TLB with zero 4-level page walks).
- Standard () Pages:
Exercise 2: Eliminating MESI False Sharing in a 16-Core Telemetry Ring
- Cache-Line Sharing & MESI Diagnosis:
- Each
BigInt64element occupies . A hardware cache line holds . - Therefore, all worker counters pack into just two cache lines (Workers contend on Line 0; Workers contend on Line 1). Every
Atomics.addissues a hardwareLOCK XADD, broadcasting Read-For-Ownership (RFO) invalidations that force the other 7 cores sharing that line intoInvalid (I)state.
- Each
- 64-Byte Padded Refactoring &
perf c2cVerification:const CACHE_LINE_BYTES = 64; const BIGINT64_STRIDE = CACHE_LINE_BYTES / BigInt64Array.BYTES_PER_ELEMENT; // 8 slots (64B) per worker const NUM_WORKERS = 16; // Allocate 16 * 64B = 1024 bytes so each worker owns an isolated 64-byte cache line const sharedBuf = new SharedArrayBuffer(NUM_WORKERS * CACHE_LINE_BYTES); const paddedCounters = new BigInt64Array(sharedBuf); export function recordPacket(workerId: number): void { Atomics.add(paddedCounters, workerId * BIGINT64_STRIDE, 1n); }- Hardware Verification: Run
perf c2c record -F 60000 -- <cmd>andperf c2c report --stdio. After applying theBIGINT64_STRIDE = 8() padding, shared cache-linelcl_hitm(local socket Hit-In-Modified) andrmt_hitm(remote NUMA Hit-In-Modified) counters onpaddedCountersdrop to .
- Hardware Verification: Run
12. Authoritative References & Version Context
- Silicon & Kernel Baseline: Cache-line (), paging (4-level
48-bit/ 5-levelLA57), and PMU tooling commands reflect 4th/5th-Gen Intel Xeon Scalable and AMD EPYC Zen 4/5 servers running DDR5 ECC memory and Linux kernel 6.x (perf stat,perf c2c,hugetlbfs). - Ulrich Drepper, “What Every Programmer Should Know About Memory”, Red Hat Research, 2007 — the definitive systems reference on DRAM internals, MESI cache coherency, TLB page walks, and cache-conscious data structures.
- Wm. A. Wulf and Sally A. McKee, “Hitting the Memory Wall: Implications of the Obvious”, ACM SIGARCH Computer Architecture News 23(1), pp. 20–24, 1995 — introduces the formal AMAT bottleneck arising from divergent CPU vs. DRAM improvement rates.
- Linux Kernel Documentation, “HugeTLB Pages (
hugetlbpage.rst)” & “What is NUMA? (numa.rst)” — authoritative Linux kernel administration guides for explicit HugePages reservation and NUMA memory policy. - Intel Corporation, “Intel 64 and IA-32 Architectures Optimization Reference Manual” — primary silicon specification for L1/L2 stream prefetchers, 64-byte cache-line false sharing avoidance, and top-down microarchitecture (
TMA) stall analysis.