1. Context & Architecture Reality
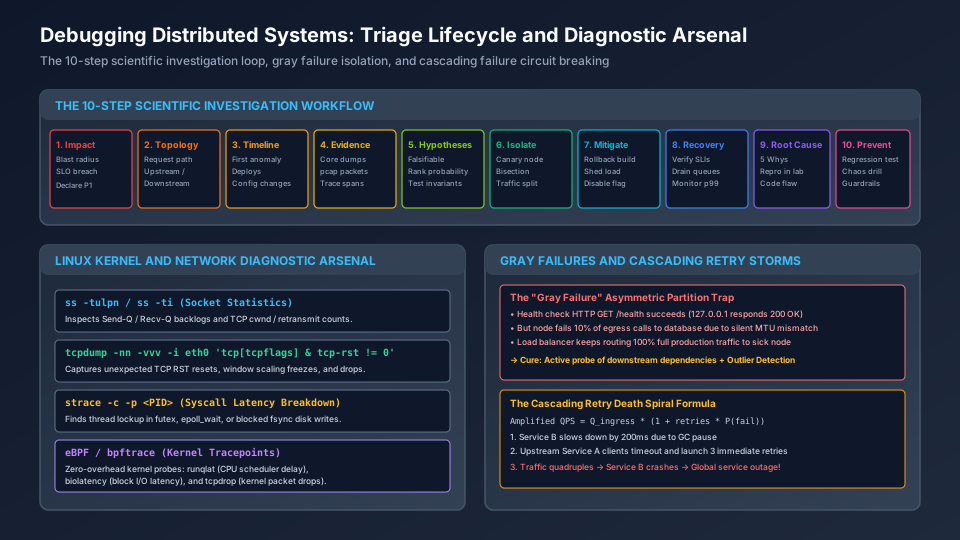
1. tcpdump -nn -vvv -i eth0 'tcp[tcpflags] & tcp-rst != 0' & strace -c -p <PID> (Syscall Latency Breakdown)
Establishes the ingress and structural boundary across tcpdump -nn -vvv -i eth0 'tcp[tcpflags] & tcp-rst != 0' & strace -c -p <PID> (Syscall Latency Breakdown): Captures unexpected TCP RST resets, window scaling freezes, and drops; Finds thread lockup in futex, epoll_wait, or blocked fsync disk writes; Zero-overhead kernel probes: runqlat (CPU scheduler delay), biolatency (block I/O latency), and tcpdrop (kernel packet drops).
2. THE 10-STEP SCIENTIFIC INVESTIGATION WORKFLOW & Impact
Coordinates core data-plane execution and state transitions through THE 10-STEP SCIENTIFIC INVESTIGATION WORKFLOW & Impact: Blast radius SLO breach Declare P1; Request path Upstream / Downstream; First anomaly Deploys Config changes.
3. Mitigate & Recovery
Enforces durability, state convergence, and output verification across Mitigate & Recovery: Rollback build Shed load Disable flag; Verify SLIs Drain queues Monitor p99; 5 Whys Repro in lab Code flaw.
When an engineer begins working with distributed systems, they typically imagine failures as binary: a server is either alive and serving traffic at 200 OK, or dead and returning a TCP Connection Refused. In production reality, binary fail-stop crashes are the easiest incidents to manage. Modern cloud schedulers (Kubernetes, ECS) detect a dead process within seconds and automatically redirect traffic to healthy replicas.
The most catastrophic distributed system outages are caused by non-binary gray failures:
- A single node in a 50-node cluster develops slow disk I/O on its NVMe drive, causing write latency to jump from to .
- A top-of-rack network switch experiences bit errors on a single fiber line, silently dropping of packets exceeding (MTU mismatch) while passing smaller TCP SYN packets cleanly.
- An upstream microservice executes unthrottled retries against a database experiencing lock contention, transforming a transient 2-second database hiccup into an exponential cascading collapse that takes down the entire customer-facing platform.
Diagnosing these complex failures requires moving beyond intuitive trial-and-error guessing. It demands a disciplined, scientific methodology backed by low-level Linux diagnostic mastery.
+--------------------------------------------------------------------------------------------------+
|                            THE CASCADING RETRY DEATH SPIRAL                                      |
|                                                                                                  |
|   1. Normal State: 10,000 QPS Ingress -> Downstream DB handles 10,000 QPS (p99 = 15ms)          |
|                                                                                                  |
|   2. Perturbation: DB checkpoint triggers temporary lock spike (p99 latency -> 350ms)           |
|                                                                                                  |
|   3. Client Reaction: Upstream timeout set to 200ms -> 100% of requests time out!                |
|      Upstream clients immediately launch 3 retries without jitter:                               |
|                                                                                                  |
|      Amplified Load = 10,000 * (1 + 3) = 40,000 QPS!                                             |
|                                                                                                  |
|   4. Downstream Collapse: DB connection pool exhausted -> Memory balloons -> OOM killer acts    |
|                                                                                                  |
|   5. Total Platform Outage: Upstream pods run out of worker threads -> Complete Blackout         |
+--------------------------------------------------------------------------------------------------+
2. Core Problem & Failure Modes
Distributed systems incidents typically fall into five distinct failure topologies:
-
Gray Failures & Differential Observability: A node fails in a way that is visible to some peers but invisible to the monitoring system. For example, a pod can ping its Kubernetes API server, but its routing table to the payment gateway is corrupted. Because the Kubernetes
livenessProbechecks a local/healthzHTTP endpoint, the orchestrator keeps routing customer payment requests to the broken pod. -
Asymmetric & Flapping Network Partitions: Network partitions are rarely clean cuts where Node A and Node B cannot communicate. More frequently, partitions are asymmetric (Node A can send packets to Node B, but return ACKs from B to A are dropped by a misconfigured firewall rule) or flapping (routes drop and reconnect every 3 seconds, triggering continuous Raft leader elections that prevent any consensus commit from succeeding).
-
Cascading Failure Amplification: When downstream services slow down, upstream queues fill up. If upstream services retry failed or timed-out requests aggressively, traffic multiplies exponentially:
Under high failure rates (), an aggressive retry policy with quadruples production traffic at the exact moment the downstream service is already drowning.
-
Thread Pool & File Descriptor Exhaustion: Synchronous blocking frameworks (e.g., standard Java Spring MVC or Python WSGI) allocate one thread per concurrent connection. When downstream calls hang waiting for a socket response, upstream threads block. Once the thread pool limit (e.g., 200 threads) is reached, the server cannot accept new incoming TCP connections, manifesting as an apparent server crash.
3. Technical Deep Dive
The 10-Step Scientific Investigation Workflow
To resolve high-severity production incidents without causing secondary damage, follow this 10-step protocol:
Step 1: Establish Impact (Quantify blast radius, breach of SLOs, declare P1 incident)
   |
Step 2: Understand Request Path (Map ingress -> gateways -> microservices -> datastores)
   |
Step 3: Establish a Timeline (When did anomalies begin? Correlate with deploys & configs)
   |
Step 4: Collect Ephemeral Evidence (Capture tcpdump pcap, heap dumps, ss socket buffers)
   |
Step 5: Form Competing Hypotheses (Brainstorm 3+ falsifiable explanations)
   |
Step 6: Isolate the Failure (Bisect nodes, route canary traffic, isolate bad AZ)
   |
Step 7: Mitigate Immediately (Rollback deploy, shed load, activate circuit breakers)
   |
Step 8: Validate Recovery (Verify p99 latencies, confirm queue drain, clear alerts)
   |
Step 9: Root Cause Analysis (5 Whys, reproduce in staging, identify code/arch defect)
   |
Step 10: Prevent Recurrence (Add automated regression tests, chaos tests, architectural guards)
Linux Kernel & Network Diagnostic Commands
When application logs and dashboards fail to explain an anomaly, low-level OS tools expose kernel reality:
1. Inspecting Socket Queue Backlogs with ss
# Check listen backlog and active receive/send queues for HTTP port 8080
ss -lnt '( sport = :8080 )'

# Output analysis:
# State   Recv-Q  Send-Q  Local Address:Port   Peer Address:Port
# LISTEN 129 128 0.0.0.0:8080 0.0.0.0:*- In
LISTENstate:Send-Q(sk_max_ack_backlog) is the configured accept queue limit (somaxconn), andRecv-Q(sk_ack_backlog) is the current number of completed 3-way handshakes waiting for the application to callaccept()(which can reachSend-Q + 1in the Linux kernel checksk_ack_backlog > sk_max_ack_backlog). WhenRecv-Q >= Send-Q, the application runtime is failing to drain the accept queue fast enough, and the kernel drops or ignores incoming TCPSYNpackets (TcpExtListenOverflows)!
2. Deep TCP Connection Analysis with ss -ti
ss -ti dst 10.0.4.15
# Output:
# cubic wscale:7,7 rto:200 rtt:1.2/0.4 ato:40 cwnd:10 ssthresh:8 retrans:12/48
retrans: 12/48: Indicates that 12 out of 48 segments were retransmitted. High retransmissions with low RTT indicate dropped packets or switch buffer saturation.
3. Zero-Overhead Kernel Tracing with eBPF
Instead of attaching heavy debuggers or running strace (which can slow process execution down by ), use eBPF tools:
bpftrace -e 'tracepoint:syscalls:sys_enter_connect { @[comm] = count(); }': Counts connection attempts across processes.runqlat: Measures CPU scheduler run queue latency (detecting CPU throttling in Kubernetes containers).biolatency: Measures disk block device I/O latency distributions.
Deep-Dive Cross-References: For in-kernel eBPF verifier/JIT internals, On-CPU vs. Off-CPU Flame Graph profiling, and Kingman queueing saturation math, see CORE-M30-001 (Systems Performance Engineering, Latency Profiling & eBPF). To apply these triage steps in interactive production outage scenarios, explore the Incident Runbooks & Debugging Drills.
4. System Design Patterns & Trade-offs
+----------------------------------------------------------------------------------------------------+
| TRADEOFF MATRIX: INCIDENT TRIAGE AND RESILIENCE PATTERNS                                          |
+--------------------------+------------------------------------+------------------------------------+
| Dimension                | Aggressive Immediate Retries       | Retry Budgets with Full Jitter     |
+--------------------------+------------------------------------+------------------------------------+
| Failure Mode             | Creates catastrophic retry storm   | Prevents load amplification        |
| Recovery Time            | Prolongs outage indefinitely       | Downstream recovers smoothly       |
| Implementation Overhead  | Trivial (`retryCount = 3`)         | Requires client-side token bucket  |
+--------------------------+------------------------------------+------------------------------------+
| Dimension                | Naive TCP Health Check             | Outlier Detection (Ejection)       |
+--------------------------+------------------------------------+------------------------------------+
| Detection Speed          | Fast for dead processes            | Fast for subtle gray failures      |
| Blast Radius             | High: routes traffic to sick nodes | Low: dynamically ejects bad nodes  |
| Complexity               | Simple ping                        | Requires sliding window error rate |
+--------------------------+------------------------------------+------------------------------------+
5. Practical Implementation
Below is a complete TypeScript distributed incident triage simulator (DistributedTriageManager) demonstrating:
- Sliding-Window Outlier Ejection & Probation Recovery (
isEjected,ejectedUntilMs) when a node’s error rate breacheserrorThresholdPercentage. - Client-Side Token-Bucket Retry Budgeting (
retryTokens,canAttemptRetry(),recordSuccessfulRequest()) limiting retries to of successful baseline traffic. - Healthy-Node Load Routing (
selectHealthyNode()) that bypasses gray-failure instances while re-admitting recovered nodes once their ejection timer expires.
export interface NodeHealth {
  nodeId: string;
  totalRequests: number;
  failedRequests: number;
  isEjected: boolean;
  ejectedUntilMs: number;
}

export interface RequestResult {
  nodeId: string;
  success: boolean;
  latencyMs: number;
}

/**
 * Outlier Detector & Circuit Breaker Manager
 * Protects distributed topologies from gray failures and retry storms.
 */
export class DistributedTriageManager {
  private nodes: Map<string, NodeHealth> = new Map();
  private retryTokens: number = 100;
  private readonly maxRetryTokens: number = 100;

  constructor(
    nodeIds: string[],
    private readonly errorThresholdPercentage: number = 25,
    private readonly ejectionDurationMs: number = 10000
  ) {
    for (const id of nodeIds) {
      this.nodes.set(id, {
        nodeId: id,
        totalRequests: 0,
        failedRequests: 0,
        isEjected: false,
        ejectedUntilMs: 0
      });
    }
  }

  /**
   * Selects an active, non-ejected node using round-robin or random selection
   */
  public selectHealthyNode(): string | null {
    const now = Date.now();
    const availableNodes: string[] = [];

    for (const [id, health] of this.nodes.entries()) {
      if (health.isEjected) {
        if (now >= health.ejectedUntilMs) {
          // Re-admit node on probation
          health.isEjected = false;
          health.totalRequests = 0;
          health.failedRequests = 0;
          availableNodes.push(id);
        }
      } else {
        availableNodes.push(id);
      }
    }

    if (availableNodes.length === 0) return null;
    const index = Math.floor(Math.random() * availableNodes.length);
    return availableNodes[index];
  }

  /**
   * Records execution outcome and triggers outlier ejection if threshold breached
   */
  public recordResult(result: RequestResult): void {
    const health = this.nodes.get(result.nodeId);
    if (!health) return;

    health.totalRequests++;
    if (!result.success) {
      health.failedRequests++;
    }

    // Evaluate outlier criteria if sufficient sample size
    if (health.totalRequests >= 20) {
      const errorRate = (health.failedRequests / health.totalRequests) * 100;
      if (errorRate >= this.errorThresholdPercentage) {
        health.isEjected = true;
        health.ejectedUntilMs = Date.now() + this.ejectionDurationMs;
      }
    }
  }

  /**
   * Enforces Retry Budget: Retries are only permitted if tokens are available.
   * Prevents cascading retry storms from multiplying downstream traffic.
   */
  public canAttemptRetry(): boolean {
    if (this.retryTokens >= 10) {
      this.retryTokens -= 10; // Consumes tokens
      return true;
    }
    return false; // Retry denied: shed load!
  }

  /**
   * Replenishes retry budget based on successful baseline traffic
   */
  public recordSuccessfulRequest(): void {
    if (this.retryTokens < this.maxRetryTokens) {
      this.retryTokens += 1;
    }
  }
}

function runDemo(): void {
  console.log("=== Distributed Triage & Anomaly Mitigation Architecture ===");
  const nodes = [
    { id: "node-1", ip: "10.0.1.1", state: "HEALTHY" as const, failureCount: 0, p99LatencyMs: 25 },
    { id: "node-2", ip: "10.0.1.2", state: "HEALTHY" as const, failureCount: 0, p99LatencyMs: 35 },
    { id: "node-3", ip: "10.0.1.3", state: "DEGRADED" as const, failureCount: 4, p99LatencyMs: 450 },
  ];
  const triage = new DistributedTriageManager(nodes.map((n) => n.id));
  for (let i = 0; i < 20; i++) {
    triage.recordResult({ nodeId: "node-3", success: false, latencyMs: 450 });
  }
  console.log(`Triage manager routing request to healthy node: ${triage.selectHealthyNode()}`);
}

runDemo();
6. Failure Scenarios & Edge Cases
1. Flapping Leader Elections in Consensus Clusters
In a 5-node Raft cluster, if Node 1 experiences intermittent network packet drops every , it repeatedly misses heartbeats from the Leader, increments its term, and initiates a disruptive election. This invalidates the current leader and drops write throughput to zero.
- Mitigation: Deploy Pre-Vote Phases (Raft Pre-Vote). A candidate node only increments its term if a quorum of peers responds affirmatively to a speculative pre-vote check, preventing isolated or flaky nodes from disrupting the cluster.
2. DNS Cache Poisoning and IP Pinning
During an outage, engineers update Route53 DNS records to point to a backup cluster. However, upstream Java virtual machines (JVM) default to networkaddress.cache.ttl = -1 (cache forever!). Even though the DNS change propagated globally, Java microservices continue hammering the failed IP address indefinitely.
- Mitigation: Explicitly configure
-Dsun.net.inetaddr.ttl=10or configure Envoy sidecars to perform asynchronous DNS resolution with strict TTL limits.
7. Production Operations & Observability
Incident Command Roles
+----------------------------------------------------------------------------------------------------+
| INCIDENT RESPONSE TEAM STRUCTURE                                                                   |
+--------------------------+-------------------------------------------------------------------------+
| Role                     | Primary Responsibility                                                  |
+--------------------------+-------------------------------------------------------------------------+
| Incident Commander (IC)  | Holds sole decision authority. Coordinates triage, approves mitigations,|
|                          | and shields investigators from executive noise.                         |
+--------------------------+-------------------------------------------------------------------------+
| Technical Lead           | Directs diagnostic investigation, evaluates hypotheses, verifies code. |
+--------------------------+-------------------------------------------------------------------------+
| Communications Lead      | Publishes internal stakeholder updates and external status page alerts.  |
+--------------------------+-------------------------------------------------------------------------+
The Blameless Post-Mortem Standard
After any P1 incident:
- Never attribute failure to “human error”: Human error is the starting point of an investigation, not the conclusion. Why was the system designed such that a single human keystroke could drop production?
- Action Items must have explicit owners and Jira links: Every mitigation item must produce a permanent code fix, automated regression test, or architectural guardrail within 14 days.
8. Security & Compliance
- Diagnostic Artifact Sanitization:
When capturing heap dumps, thread dumps, or network packet captures (
.pcap), memory contains plain-text user passwords, authorization tokens, and encryption keys.- Store diagnostic artifacts in encrypted, short-lived S3 buckets with restricted IAM access and automatic 7-day lifecycle purge policies.
- Access Control for Diagnostic Tooling:
Tools like
strace,tcpdump, andgdbrequire LinuxCAP_SYS_PTRACEandCAP_NET_ADMINcapabilities. Restrict these permissions to dedicated ephemeral debug containers deployed via secure audit-logged workflows (e.g.,kubectl debug).
9. Real-World Case Studies
AWS S3 February 2017 Outage
During a routine maintenance operation on S3 billing sub-systems in us-east-1, an engineer entered an authorized command intending to take a small number of billing servers offline. A typographical error expanded the server parameter, removing a critical mass of servers that supported two vital sub-systems: the Index subsystem (managing all S3 object metadata) and the Placement subsystem.
- Root Cause & Amplification: Re-initializing the Index subsystem from scratch required rebuilding massive in-memory caches. As it started, dependent AWS services (EC2, EBS, Lambda) began failing health checks simultaneously, launching massive waves of restart requests that overwhelmed the recovering systems.
- Takeaway: Critical control plane infrastructure must feature programmatic guardrails that reject removal of more than a fixed percentage of capacity, and recovery processes must support warm checkpoint loading.
10. Technology Comparison Matrix
+----------------------------------------------------------------------------------------------------+
| LINUX DIAGNOSTIC AND INVESTIGATION TOOLS                                                           |
+----------------------+--------------------+--------------------+-----------------------------------+
| Tool                 | Layer              | Performance Impact | Ideal Use Case                    |
+----------------------+--------------------+--------------------+-----------------------------------+
| ss                   | Transport / Socket | Near Zero          | Socket buffer backlogs & cwnd     |
+----------------------+--------------------+--------------------+-----------------------------------+
| tcpdump              | Network / IP       | Low to Medium      | Packet drops, TCP RSTs, TLS handshakes |
+----------------------+--------------------+--------------------+-----------------------------------+
| strace               | System Call        | Very High (50x)    | Debugging process deadlocks (hangs)|
+----------------------+--------------------+--------------------+-----------------------------------+
| eBPF / bpftrace      | Kernel Tracepoints | Extremely Low (<1%)| Production latency profiling      |
+----------------------+--------------------+--------------------+-----------------------------------+
| perf / Flame Graphs  | CPU & Stack Frames | Very Low (1-3%)    | High CPU hotspot identification   |
+----------------------+--------------------+--------------------+-----------------------------------+
11. Design Challenge & Exercise
Scenario: The Mystery Midnight 502 Spike
Every night at 00:03 UTC, your company’s mobile payment gateway experiences a 90-second burst of HTTP 502 Bad Gateway errors affecting of incoming transactions. The errors vanish completely by 00:05 UTC.
Observed Evidence:
- Kubernetes pod CPU and memory usage remain below .
- Upstream Envoy ingress logs show
upstream_reset_before_response_started{connection_termination}. - A scheduled cron job runs at 00:00 UTC to archive daily transactions into Amazon S3.
Your Task:
- Formulate 3 competing, falsifiable hypotheses explaining why the connection is severed.
- Specify the exact Linux commands and eBPF scripts you will run on the payment nodes to prove or disprove each hypothesis.
- Design an immediate mitigation to protect payment transactions without cancelling the nightly archive job.
View Reference Architecture & Worked Solutions (CORE-M27-001)
1. Three Competing, Falsifiable Hypotheses for the 00:03 UTC 502 Spike
- Hypothesis A — Linux Conntrack / Ephemeral Source Port Exhaustion via S3 UploadBurst: At 00:00 UTC, the S3 archive job opens thousands of short-lived TLS connections per second without HTTP connection pooling, exhausting
net.ipv4.ip_local_port_rangeor fillingnf_conntrack_maxby 00:03 UTC and causing the kernel to sendRSTpackets. - Hypothesis B — Linux CFS CPU Quota / NVMe Writeback Page-Cache Stall: At 00:03 UTC, the archive job compresses a multi-GB batch or triggers kernel dirty-page writeback (
vm.dirty_ratio), stalling payment worker threads inD(uninterruptible disk sleep) or CFS throttling so the payment server’s listen queue overflows (Recv-Q >= Send-Q) or Keep-Alive idle timers race with Envoy. - Hypothesis C — HTTP Keep-Alive Idle Timeout Race (
upstream_reset_before_response_started): Load spike or GC pause at 00:03 UTC causes the backend payment service to close idle keep-alive sockets (keepAliveTimeout = 5s) at the exact millisecond Envoy dispatches a new request over a pooled connection.
2. Exact Linux & eBPF Diagnostic Commands to Prove/Disprove Each Hypothesis
- Test Hypothesis A (Conntrack / Ephemeral Ports):
ss -sandss -tan state time-wait | wc -l(checkTIME-WAITsocket accumulation).sysctl net.netfilter.nf_conntrack_count net.netfilter.nf_conntrack_maxanddmesg -T | grep conntrack.
- Test Hypothesis B (Listen Queue Overflow / Scheduler / Disk Stall):
nstat -az TcpExtListenOverflows TcpExtListenDropsandss -lnt '( sport = :8080 )'.bpftrace -e 'tracepoint:sched:sched_process_hang { printf("%s hung\n", comm); }'andrunqlat 1 120+biolatency 1 120across the 00:00–00:05 UTC window.
- Test Hypothesis C (TCP RST / Keep-Alive Race):
tcpdump -nn -i any 'port 8080 and (tcp[tcpflags] & (tcp-rst|tcp-fin) != 0)' -w /tmp/midnight_rst.pcapbpftrace -e 'tracepoint:tcp:tcp_send_reset { @[comm, args->saddr, args->dport] = count(); }'to identify which exact kernel/user process initiates the TCPRST.
3. Immediate Mitigation & Permanent Architectural Isolation
- Isolate Batch Cron Job onto Dedicated Worker Nodes/Cgroups: Move the 00:00 UTC S3 archive job out of the payment gateway pods/nodes into a dedicated Kubernetes
Jobnode pool (or constrain it withionice -c 3idle I/O priority,nice -n 19, and a token-bucket S3 multipart upload stream using a single pooled HTTP/2 client). - Fix Keep-Alive Timeout Ordering: Ensure backend application
keepAliveTimeout() is strictly greater than Envoy upstreamidle_timeout(), and enable Envoyretry_on: reset,connect-failurefor idempotent requests.
12. Assessment
Review the 4 scenario-based quiz questions at the top of this lesson to test your mastery of 10-step incident investigation, socket diagnostics, and cascading failure containment.
13. Summary & Architectural Decision Guide
- Verify Socket Backlogs First: Check
ss -lntandnetstat -s | grep overflowbefore blaming application code for connection timeouts. - Enforce Client Deadlines: Propagate gRPC deadlines (
grpc-timeout) across all downstream hops to prevent dead work from burning server CPU. - Tune GC Pauses: Sizing off-heap buffers in Java/Go storage engines avoids multi-second Stop-The-World pauses that trigger false cluster failovers.
- Deploy tcpdump / eBPF on Tricky Heisenbugs: Packet captures and eBPF socket traces provide ground-truth evidence when logs and metrics disagree.
14. Authoritative References & Version Context
- Brendan Gregg (2020), “Systems Performance: Enterprise and the Cloud (2nd Edition)”, Addison-Wesley: Performance methodologies (USE Method) — brendangregg.com
- Charity Majors, Liz Fong-Jones, and George Miranda (2022), “Observability Engineering: Achieving Production Excellence”, O’Reilly Media — oreilly.com
- Linux Manual Pages — ss(8), ip-tcp(7), and proc(5) — man7.org/linux/man-pages/man8/ss.8.html
- Version Context: Troubleshooting tooling reflects Linux 6.x kernel diagnostics (
ss,perf,bpftrace), OpenTelemetry collectors, and modern container runtimes.